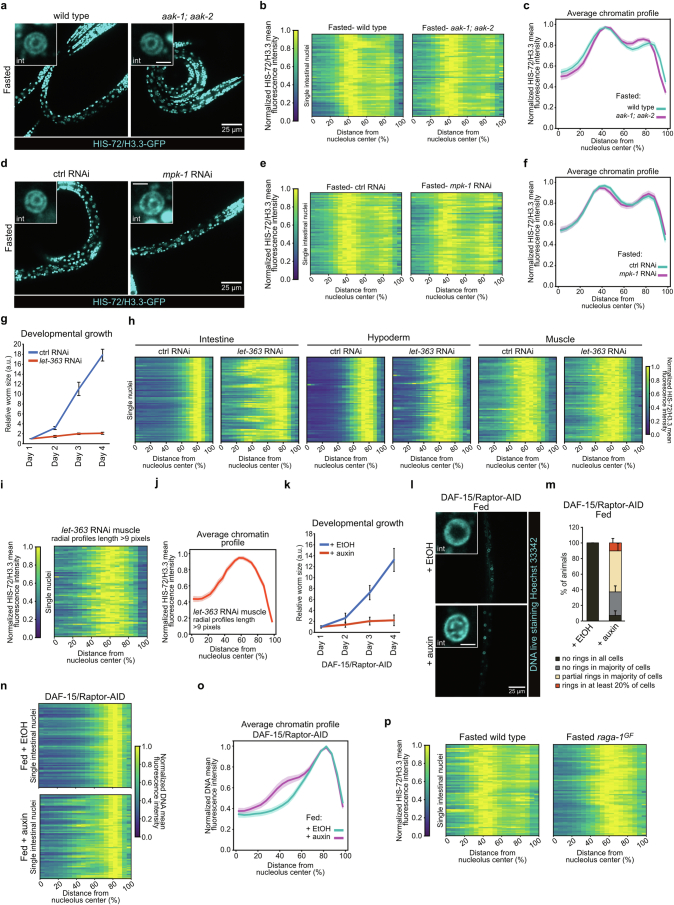
Extended Data Fig. 3. related to Fig. 3.
a, Single focal planes of representative fasted L1 larvae of the indicated genotype, expressing fluorescently tagged HIS-72/H3.3. Insets: zoom of single intestine nucleus. Inset scale bar, 2.5 μm. b, Heatmaps showing the radial fluorescence intensity profiles of HIS-72/H3.3-GFP in 60 intestinal nuclei of fasted wild type or aak-1; aak-2 mutant as a relative distance from the nucleolus center. Each row corresponds to a single nucleus, segmented in 2D at its central plane. Data are from 4 independent biological replicas. c, Line plot of the averaged single nuclei profile shown in (b). The shaded area represents the 95% confidence interval of the mean profile. d, As in (a) but of fasted wt L1 larvae under control or mpk-1 RNAi. e, Heatmaps as in (b) but of 60 intestinal nuclei of wt L1 larvae under control or mpk-1 RNAi from 3 independent biological replicas. f, Line plot as in (c) but of the averaged single nuclei profile shown in (e). g, Line plot comparing the differences in developmental growth between control and let-363 RNAi animals, as measured by body size. Day 1 represents the first day after hatching. Data are shown as mean ± SEM of 4 independent biological replicas. h, Heatmaps as in (b) but of 72 intestinal nuclei of the indicated tissue of fed L1 larvae treated with control or let-363 RNAi from 3 independent biological replicas. i, Heatmap as in (b) but of 74 muscle nuclei of fed L1s treated with let-363 RNAi where individual radial profiles with nucleolar edge-nuclear periphery length lower than 9 pixels were excluded. Data are from 3 independent biological replicas. j, Line plots as in (c) but of the averaged single nuclei profile shown in (i). k, Line plot as in (g) but of fed animals, expressing an endogenously degron-tagged (AID) DAF-15/Raptor treated with 1 mM auxin or EtOH (control). Data are shown as mean ±SEM of 3 independent biological replicas. l, As in (a) but of fed L1 larvae expressing an endogenously tagged DAF-15/Raptor-AID treated with 1 mM auxin, or EtOH (control), and where the DNA has been stained with Hoechst 33342. m, Quantification of the percentage of fed DAF-15/Raptor-AID animals treated with 1 mM auxin or EtOH within the indicated categories for 3D chromatin organization in intestine. Data are shown as mean ±SEM of 3 independent biological replicas. n, Heatmaps as in (b) but of Hoechst 33342-stained DNA in intestinal nuclei of fed L1 expressing DAF-15/Raptor-AID, treated with 1 mM auxin or EtOH. 72 and 71 intestinal nuclei were analysed for 1 mM auxin and EtOH, respectively, from 3 independent biological replicas. For auxin-treated individuals, animals in proportions to their relative abundance within the chromatin organization categories as in (m) were analysed. o, Line plots as in (c) but of the averaged single nuclei profile shown in (n). p, Heatmaps as in (b) but for 72 intestinal nuclei of fasted wt and raga-1GF animals. Data are from 3 and 4 independent biological replicas for raga-1GF and wt, respectively. Source numerical data are available in source data.

