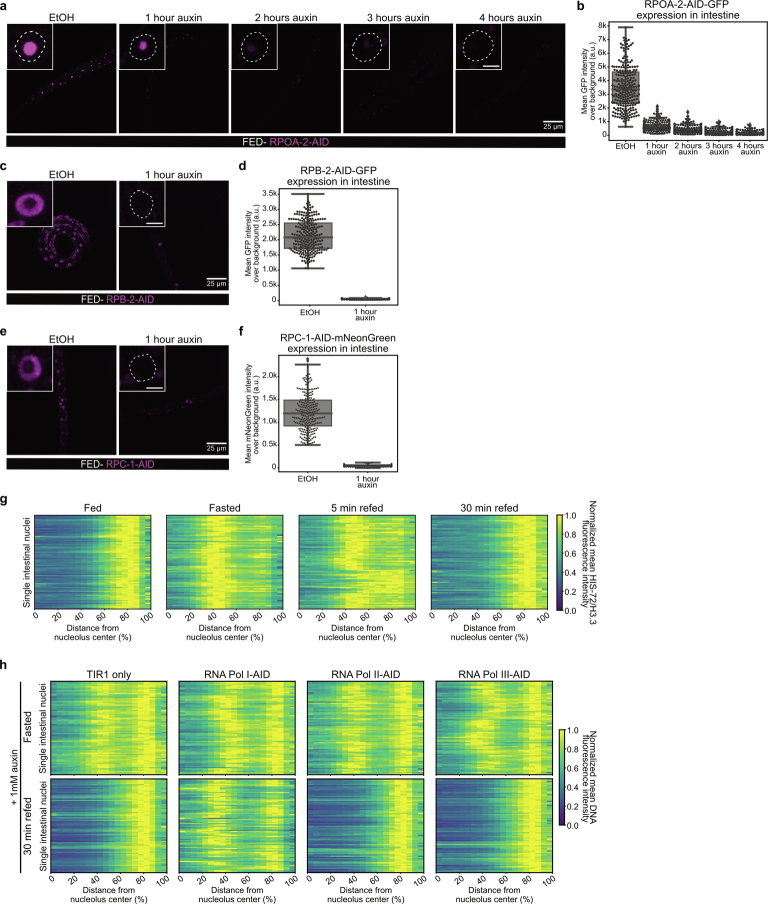
Extended Data Fig. 5. related to Fig. 5.
a, Single focal planes of representative fed L1 larvae expressing RPOA-2-GFP-AID from its endogenous locus, and TIR1, control treated (EtOH), or treated with 1 mM auxin for the indicated amount of time. Insets: zoom of single intestinal nucleus. Inset scale bar, 2.5 μm. b, Boxplot comparing the mean fluorescence intensity of RPOA-2-GFP-AID in intestinal nuclei in fed L1s expressing RPOA-2-GFP-AID and TIR1, control treated (EtOH), or treated with 1 mM auxin for the indicated amount of time. c, As in (a), but for animals expressing RPB-2-AID-GFP. d, As in (b), but for animals expressing RPB-2-AID-GFP. e, As in (a), but for animals expressing RPC-1-AID-mNeonGreen. f, As in (b), but for animals expressing RPC-1-AID-mNeonGreen. For b, d and f, data are from 2 independent biological replicas. See n in Supplementary Table 2. Box limits are 25th and 75th percentiles, whiskers denote 1.5 times the interquartile ranges, points outside the whiskers are outliers, and the median is shown as a line. g) Heatmaps showing the radial fluorescence intensity profiles of HIS-72/H3.3-GFP in intestinal nuclei of wt animals of the indicated nutritional status as a function of the relative distance from the nucleolus center. Each row corresponds to a single nucleus, segmented in 2D at its central plane. 72 intestinal nuclei were analyzed in animals from 3 independent biological replicas. h, Heatmaps as in (g) but of Hoechst 33342-stained DNA in intestinal nuclei of animals expressing the indicated AID tag or TIR1 only, as control, that were fasted or 30 minutes refed in presence of 1 mM auxin. 72 intestinal nuclei were analyzed, except for fasted RNA Pol II-AID and 30 minutes refed TIR1 only, where 69 and 71 nuclei were analyzed, respectively. Data are from 3 independent biological replicas. For RNA Pol II-AID 30 minutes refed, animals in proportions to their relative abundance within the 3D chromatin organization categories as in (Fig. 5f) were analyzed. Source numerical data are available in source data.

