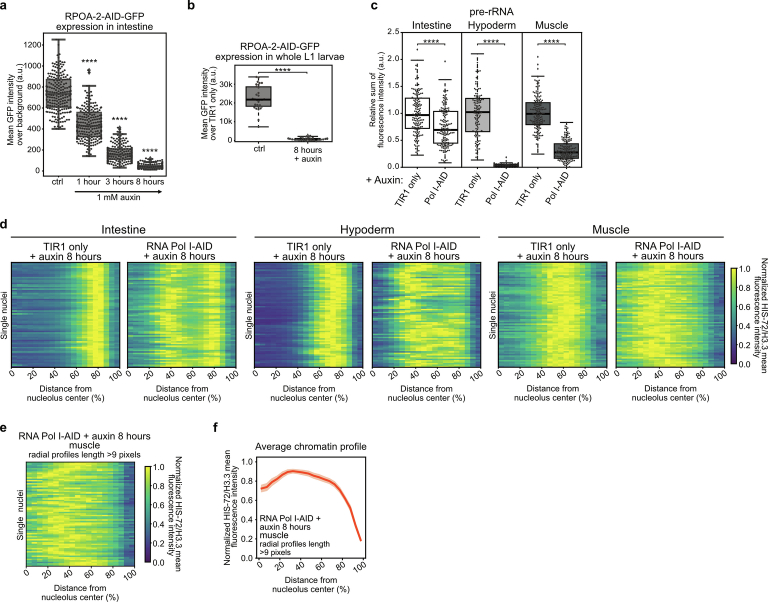
Extended Data Fig. 7. related to Fig. 7.
a, Boxplot comparing the expression of RPOA-2-AID-GFP in the intestine of fed L1 larvae expressing ubiquitous TIR1-BFP and treated with 1 mM auxin for the indicated time. Data are from 3 independent biological replicas. b, same as (a) but in whole larvae that were treated with 1 mM auxin for 8 hours. 30 animals from 2 independent biological replicas were analysed. c, Boxplot showing the relative changes in pre-rRNA levels, measured by FISH, in intestine, hypoderm and muscle cells of Pol I-AID animals, compared to the corresponding tissue in TIR1 only animals, upon treatment with 1 mM auxin for 8 hours. The results from 3 independent biological replicas are shown. For (a-c), box limits are 25th and 75th percentiles, whiskers denote 1.5 times the interquartile ranges, points outside the whiskers are outliers, and the median is shown as a line. Probability values from two-sided Wilcoxon rank sum tests comparing to control are shown: **** indicate p value < 0,0001. See p values and n in Supplementary Table 2. d, Heatmaps showing the radial fluorescence intensity profiles of HIS-72/H3.3-GFP in the indicated tissues of fed animals expressing ubiquitous TIR1 alone (TIR1 only) or with RPOA-2-AID (Pol I-AID) in presence of 1 mM auxin, as a function of the relative distance from the nucleolus center. Each row corresponds to a single nucleus, segmented in 2D at its central plane. 72 intestinal nuclei were analysed in animals from 3 independent biological replicas. e, Heatmap as in (d) but for muscle nuclei of Pol I-AID animals where individual radial profiles with nucleolar edge-nuclear periphery length lower than 9 pixels were excluded. 69 muscle nuclei were analysed in animals from 3 independent biological replicas. f, Line plots of the averaged single nuclei profile shown in (e). The shaded area represents the 95% confidence interval of the mean profile. Source numerical data are available in source data.

