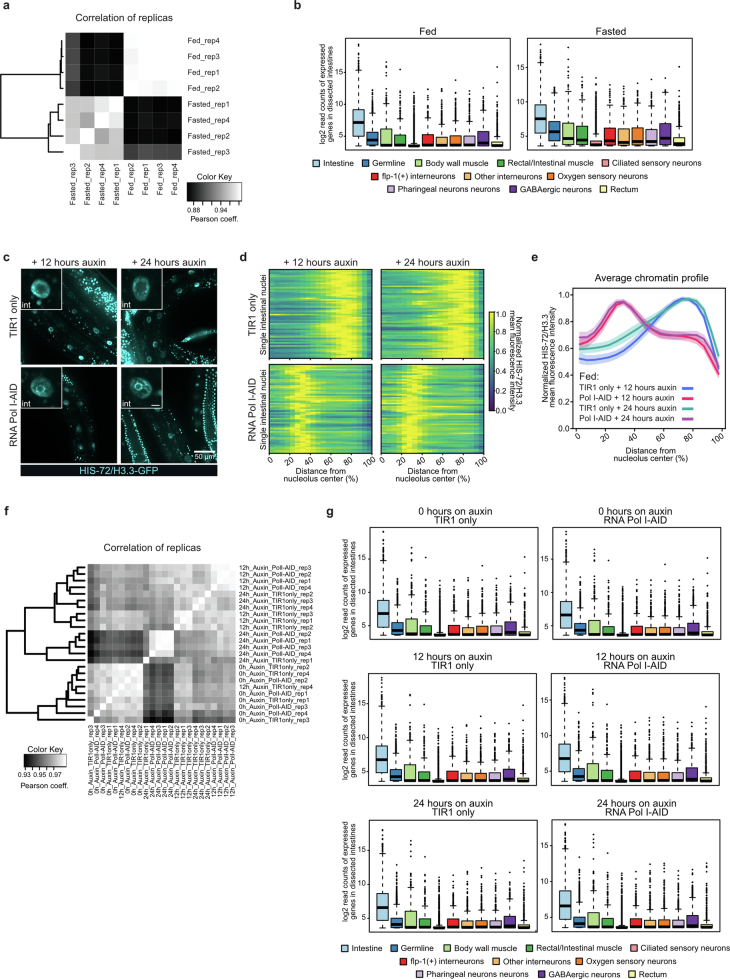
Extended Data Fig. 8. related to Fig. 8.
a, Pearson correlation analysis between the biological replicates of intestinal RNA samples of fasted and fed adults. b, Boxplots showing the enrichment of the genes expressed in the dissected intestines of fed and fasted animals within expression datasets from different tissues indicated with different colors. The samples are enriched in intestinally-expressed genes (labelled in light blue). c, Single focal planes of representative fed adults expressing HIS-72/H3.3-GFP, ubiquitous TIR1 alone (TIR1 only) or with RPOA-2-AID (Pol I-AID), treated with 1 mM auxin for the indicated time. Insets: zoom of single intestinal nucleus. Inset scale bar, 5 μm. d, Heatmaps showing the radial fluorescence intensity profiles of HIS-72/H3.3-GFP in intestinal nuclei of adults, expressing ubiquitous TIR1 alone (TIR1 only) or with RPOA-2-AID (Pol I-AID), treated with 1 mM auxin for the indicated time, as a function of the relative distance from the nucleolus center. Each row corresponds to a single nucleus, segmented in 2D at its central plane. 60 intestinal nuclei were analysed in animals from 3 independent biological replicas. e, Line plots of the averaged single nuclei profile shown in (d). The shaded area represents the 95% confidence interval of the mean profile. f, As in (a) but for adults expressing TIR1 alone (TIR1 only) or with RPOA-2-AID (Pol I-AID), treated with 1 mM auxin for the indicated time. g, As in (b) but for adults expressing TIR1 alone (TIR1 only) or with RPOA-2-AID (Pol I-AID), treated with 1 mM auxin for the indicated time. For b and g, the average of 4 biological replicas is shown. The boxes represent 50%, and whiskers 90% of the group. The median is shown as a line and outliers are indicated as dots. Source numerical data are available in source data.

