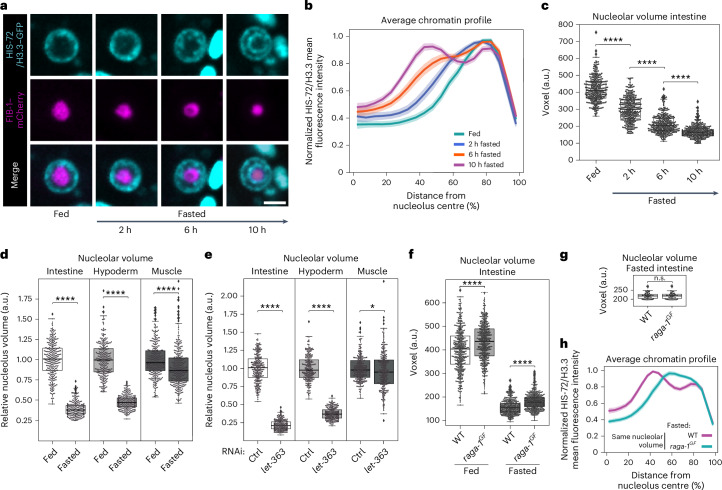
Fig. 4. Remodelling of the nucleolus correlates with chromatin ring formation.
a, Single focal planes of representative single intestinal nuclei expressing HIS-72/H3.3–GFP and FIB-1–mCherry in WT L1 larvae that were fed or fasted for the indicated time. Scale bar, 2.5 μm. b, Line plots of the averaged single nuclei profile of HIS-72/H3.3–GFP from 72 intestinal nuclei of WT animals under the indicated nutritional status, from three independent biological replicas, showing the radial fluorescence intensity as a function of the relative distance from the nucleolus centre. The shaded area represents the 95% confidence interval of the mean profile. Single-peak profiles were compared to estimate the statistical significance of differences, as described in Methods. P values are given in Supplementary Table 2. c, Box plot comparing the volume of the nucleolus, measured with FIB-1–mCherry, in the intestine of larvae that were fed or fasted for the indicated time. d, Box plot as in c but in the intestine, hypoderm and muscle of fasted WT animals relative to the corresponding tissue in fed animals. e, Box plot as in d but for fed larvae under let-363 RNAi relative to control RNAi in the corresponding tissue. f, Box plot as in c but in the intestine of fed and fasted WT and raga-1GF larvae. g, Box plot as in f but for 50 fasted WT and raga-1GF intestinal cells selected for having the same nucleolar volume. h, Line plots as in b but of the averaged single nuclei profile of HIS-72/H3.3–GFP from the intestinal nuclei shown in g. For b and h, heat maps displaying the single nuclei profiles are provided in Extended Data Fig. 4a,c, respectively. For c–g, box limits are 25th and 75th percentiles, whiskers denote 1.5 times the interquartile ranges, points outside the whiskers are outliers and the median is shown as a line. Probability values from two-sided Wilcoxon rank sum tests are shown: *P < 0.05 and ****P < 0.0001. Data are from three independent biological replicas. See P values and n in Supplementary Table 2. Source numerical data are available in Source data.

