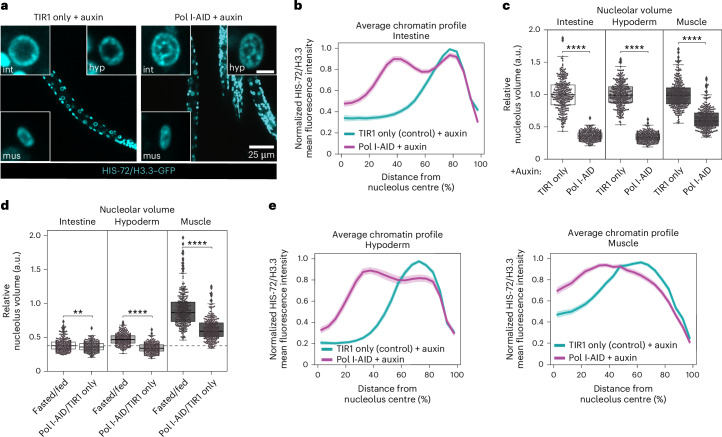
Fig. 7. RNA Pol I depletion is sufficient to trigger the formation of chromatin rings in hypoderm of fed animals.
a, Single focal planes of representative fed L1 larvae expressing HIS-72/H3.3–GFP, ubiquitous TIR1 alone (TIR1 only) or with RPOA-2-AID (Pol I-AID), treated with 1 mM auxin for 8 h. Insets: zoom of single nucleus of the indicated tissue. Hyp: hypoderm; int: intestine; mus: muscle. Inset scale bar, 2.5 μm. b, Line plot of the averaged single nuclei profile of HIS-72/H3.3–GFP from 72 intestinal nuclei of fed, Pol I-AID or TIR1 only as control, in the presence of 1 mM auxin, showing the radial fluorescence intensity as a function of the relative distance from the nucleolus centre. The shaded area represents the 95% confidence interval of the mean profile. Data are from three independent biological replicas. c, Box plot showing relative changes in nucleolar volume, measured using FIB-1–mCherry, in intestine, hypoderm and muscle cells of Pol I-AID animals, compared with control TIR1 only, in the corresponding tissue upon treatment with 1 mM auxin for 8 h. d, Box plot as in c but comparing fasted over fed animals and Pol I-AID over TIR1 only animals (upon 1 mM auxin exposure for 8 h), in the indicated tissues. The dotted grey line represents the median reduction in nucleolar volume in fasted intestine over fed. e, Line plots as in b but in 72 hypodermal and muscle nuclei from three independent biological replicas. Single-peak profiles were compared to estimate the statistical significance of differences, as described in Methods. P values are given in Supplementary Table 2. For b and e, heat maps displaying the single nuclei profiles are provided in Extended Data Fig. 7d. For c and d, box limits are 25th and 75th percentiles, whiskers denote 1.5 times the interquartile ranges, points outside the whiskers are outliers and the median is shown as a line. Probability values from two-sided Wilcoxon rank sum tests are shown: **P < 0.01 and ****P < 0.0001. Data are from three independent biological replicas. See P values and n in Supplementary Table 2. Source numerical data are available in Source data.

