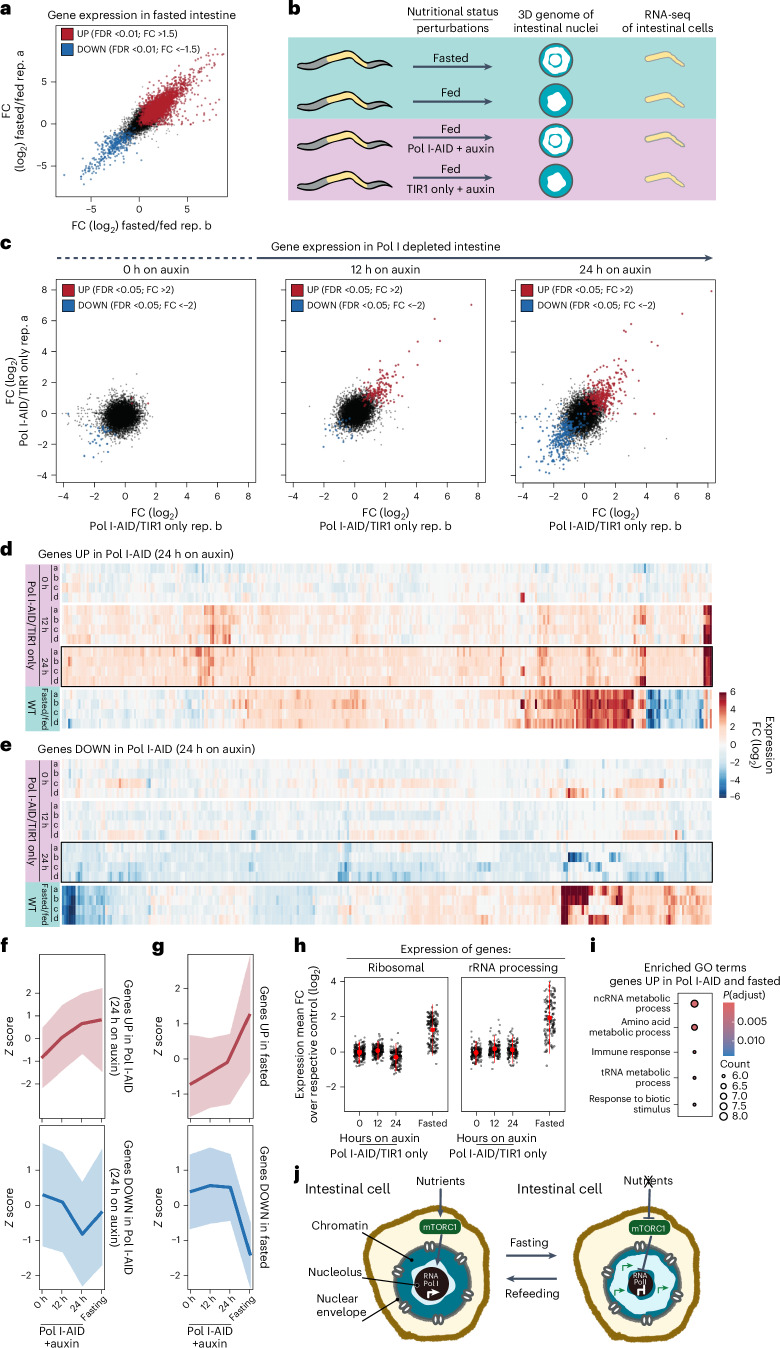
Fig. 8. Specific genes are upregulated when chromatin rings form.
a, Representative scatter plot comparing the relative gene expression FCs in intestinal cells of WT fasted animals compared to fed in two different biological replicas (rep). In red and in blue are the upregulated (UP) and downregulated (DOWN) genes, respectively (FDR <0.01 and 1.5 FC, N = 4). b, A scheme of the rational of the RNA-seq experiment in a and c–i). c, Scatter plots as in a but in intestines of animals expressing RPOA-2-AID (Pol I-AID) compared with control (TIR1 only), treated with 1 mM auxin for the indicated time. Significant up- and downregulated transcripts are highlighted in red and blue, respectively (FDR <0.05 and 2.0 FC, N = 4). d, Heat map of the expression changes of the genes that are significantly upregulated in the intestine of Pol I-AID after 24 h on auxin (encircled with a black square) in the intestine of Pol I-AID at 0 and 12 h on auxin and of fasted animals. e, Heat map as in d but of genes that are downregulated in the intestine of Pol I-AID after 24 h on auxin. f, Line plots of z-score values to measure the relative expression changes of genes that are upregulated (top) or downregulated (bottom) in Pol I-AID (24 h on auxin), in Pol I-AID at 0 and 12 h on auxin and in the intestine of fasted animals. Data are shown as mean ± s.d. of four biological replicas. g, As in f but for genes that are upregulated (top) or downregulated (bottom) upon fasting. h, Comparison of the relative expression of genes belonging to the GO category of ‘ribosomal’ or ‘rRNA processing’ in the intestine of Pol I-AID, treated with 1 mM auxin for the indicated time or in WT fasted animals. Data are shown as mean ± s.d. of four biological replicas. i, GO term enrichment for genes upregulated both in Pol I-depleted (24 h on auxin) and fasted animals. ncRNA, non-coding RNA; tRNA, transfer RNA. Significance was calculated using the hypergeometric test, adjusted for multiple testing with the default g:SCS (set counts and sizes) method integrated into the gprofiler2 R package. j, A model showing that in fed animals, mTORC1 promotes transcription by RNA Pol I. During fasting, mTORC1 inactivation represses RNA Pol I transcription leading to a drastic reduction in nucleolar size in intestinal cells, thus promoting a 3D reorganization of the genome, which becomes enriched at the nuclear and nucleolar periphery. This 3D chromatin configuration might support the upregulation of a set of metabolic and stress-related genes.

