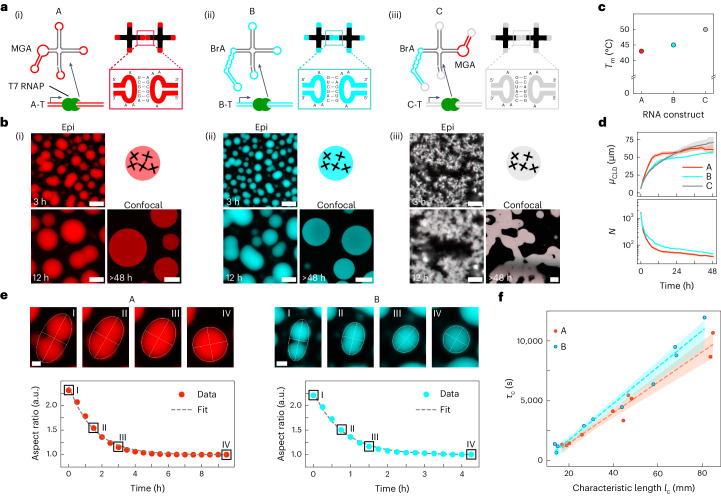
Fig. 1. Condensation of co-transcriptionally folding RNA nanostars.
a, Structure of the RNA motifs. An A-type RNA nanostar includes an MGA (i), B-type includes a BrA (ii) and C-type includes both aptamers (iii). Variants feature mutually orthogonal, self-complementary (palindromic) KLs, whose sequences are shown in the insets. RNA nanostars are transcribed from linear dsDNA templates by T7 RNAP. b, Epifluorescence and confocal micrographs showing condensate formation and coarsening for all three designs in a at different timepoints of an in vitro transcription reaction. Epifluorescence micrographs have been linearly re-scaled to enhance contrast (Supplementary Methods 2). Pristine micrographs are shown in Supplementary Fig. 5. Scale bars, 50 μm. Timestamps are reported with respect to the start of time-lapse imaging (Methods and Supplementary Table 5). c, Melting temperatures (Tm) of A–C condensates, determined as discussed in Methods, Supplementary Methods 2, and Supplementary Figs. 8 and 9. d, Top: mean of the CLD, μCLD. Bottom: average number of condensates per microscopy field of view, N, as a function of time. Full CLDs, as extracted from image segmentation, are shown in Supplementary Fig. 17 (Supplementary Methods 2). N is not computed for system C, which does not form discrete aggregates. Data are shown as mean (solid lines) ± s.d. (top) or s.e. (bottom) (shaded regions) of three field of views within one sample. e, Top: epifluorescence micrographs (contrast enhanced) depicting coalescence events for A (left) and B (right) condensates. Scale bars, 15 μm. Bottom: time-dependent aspect ratio of the condensates above, computed as the ratio between major and minor axes of the best-fit ellipse. The dashed line shows an exponential fit with decay constant τc. f, τc against the characteristic size (lc) of A and B condensates undergoing coalescence. Linear regression yields inverse capillary velocities μ/γ = 127.4 s μm−1 and 152.3 s μm−1 for A and B condensates, respectively46 (Supplementary Methods 2). The dashed lines indicate best fits, with 95% confidence intervals shown as shaded regions. Transcription and coalescence events occurred at constant 30 °C temperature (Methods).

