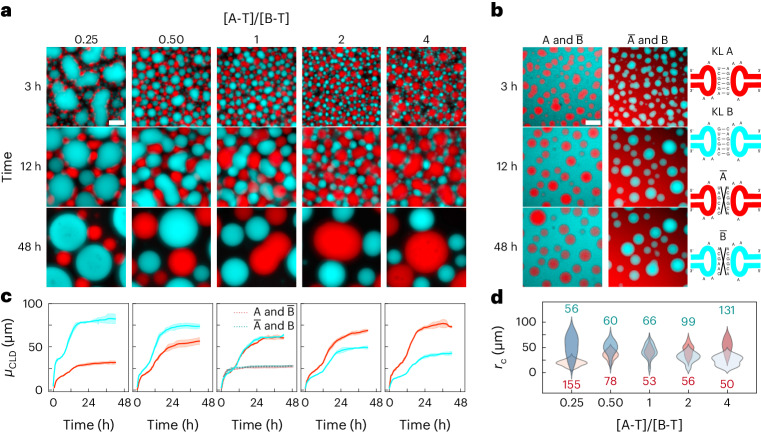
Fig. 2. Co-transcribed orthogonal RNA nanostars form immiscible condensates of controlled size.
a, Epifluorescence micrographs of binary systems of A and B RNA nanostars (see Fig. 1) at various timepoints during the transcription transient. Different ratios between the concentrations of the two templates, A-T and B-T, are tested, while keeping [A-T] + [B-T] constant. b, Epifluorescence snapshots analogous to a, but where either A or B is replaced by its non-sticky variant, namely, or . Sketches on the right-hand side show examples of scrambled non-binding KL sequences. c, Time evolution of μCLD (Supplementary Methods 2), for samples in a and b, the latter shown in the central panel as dashed lines. See Supplementary Fig. 23 for full CLDs. Red and cyan curves are relative to A and B condensates, respectively. Data are shown as mean (solid/dashed lines) ± s.d. (shaded regions) of three fields of view within one sample. d, Distribution of the radii, rc, of A (red) and B (cyan) condensates as a function of the template concentration ratio [A-T]/[B-T]. Epifluorescence micrographs in a and b have been linearly re-scaled to enhance contrast (Supplementary Methods 2). Pristine micrographs are shown in Supplementary Figs. 19 and 21. All scale bars, 50 μm. Timestamps are reported with respect to the start of time-lapse imaging (Methods and Supplementary Table 5).

