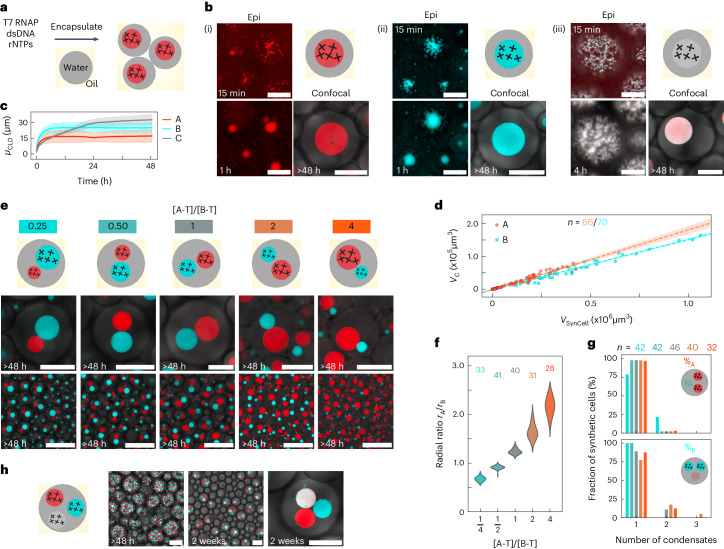
Fig. 3. Membrane-less RNA organelles expressed in synthetic cells.
a, Diagram showing MLOs formed in synthetic cells consisting of W/O emulsion droplets encapsulating transcription machinery, ribonucleotide triphosphates (rNTPs) and DNA templates. b, Epifluorescence and confocal micrographs showing MLO formation over time in synthetic cells expressing A-type (i), B-type (ii) and C-type (iii) RNA nanostars (see Fig. 1). Epifluorescence micrographs have been linearly re-scaled to enhance contrast (Supplementary Methods 2). Pristine images are shown in Supplementary Fig. 27, alongside images relative to additional timepoints. Timestamps are reported with respect to the start of time-lapse imaging (Methods and Supplementary Table 6). c, Time-dependent mean of μCLD, computed as discussed in Supplementary Methods 2. Data are shown as mean (solid line) ± s.d. (shaded region) from three fields of view within one sample. d, Scatter plot of condensate volume (VC) versus synthetic cell volume (VSynCell) for samples in b(i) and b(ii). Dashed lines indicate best fits to linear regression models, with 95% confidence intervals shown as shaded regions (Supplementary Methods 3). MLOs occupy 18.2 ± 0.5% and 15.3 ± 0.3% of the volume of the synthetic cells for A and B systems, respectively. e, Zoomed-in (top) and larger field-of-view (bottom) confocal micrographs depicting synthetic cells co-expressing A- and B-type condensates, with different template concentration ratios [A-T]/[B-T] (compare Fig. 2a). f, Distribution of the ratio between the radii of A and B MLOs (rA/rB) as a function of [A-T]/[B-T] for samples in e (Supplementary Methods 3). g, Percentage of synthetic cells containing a given number of A-type (top) or B-type (bottom) MLOs. The percentages of synthetic cells containing exactly one A and one B MLOs are 78.57%, 97.62%, 86.96%, 77.50% and 87.50% for [A-T]/[B-T] = 0.25, 0.50, 1, 2 and 4, respectively. Colour codes in f and g match those in e. Numbers in f and g indicate sampled synthetic cells. h, Confocal micrographs showing synthetic cells expressing three orthogonal MLO-forming RNA nanostars (A, B and C in Fig. 1) at different timepoints. Scale bars in e, bottom, and h, left and centre, are 150 μm. All other scale bars, 50 μm.

