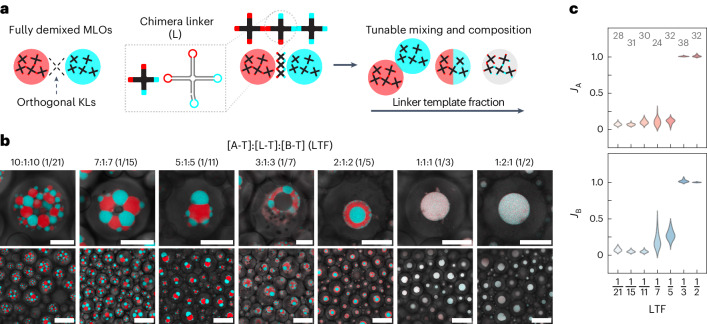
Fig. 4. Controlling morphology and composition of MLOs with linker RNA nanostars.
a, Chimeric RNA linker nanostars (L), with two A and two B KLs, enable control over mixing in systems of A and B nanostars by varying the relative concentration of the linker template L-T. b, Zoomed-in (top) and larger field-of-view (bottom) confocal micrographs, acquired after more than 48 h from the start of transcription, depicting synthetic cells producing A, B and L nanostars with different ratios between DNA templates ([A-T]:[L-T]:[B-T]). The LTF, shown in brackets, is computed as [L-T]/([A-T] + [L-T] + [B-T]). For LTF = 1/3 and 1/2, slight changes in condensate colour occur away from the confocal imaging plane, probably due to differences in the extinction coefficients of MG and DFHBI. Scale bars, 50 μm (top) and 150 μm (bottom). c, Distributions of mixing indices JA and JB of the MLOs (calculated as discussed in Supplementary Methods 3) and shown as a function of LTF for samples in b. Low JA and JB are indicative of purer A-rich and B-rich phases, while JA, JB ≈ 1 indicate complete mixing of the two RNA species. Numbers indicate examined synthetic cells.

