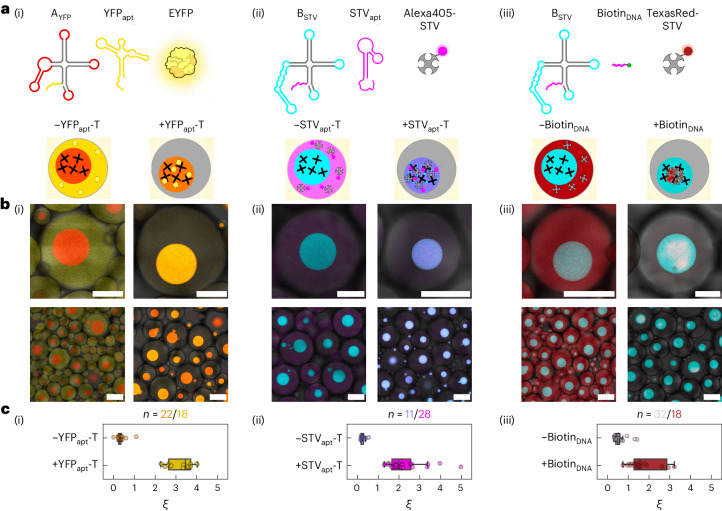
Fig. 5. Selective protein capture in designer RNA MLOs.
a, RNA-nanostar designs are modified to include a single-stranded 5′ overhang that can connect to a protein-binding moiety. Design AYFP is identical to nanostar A (Fig. 1) but can connect to YFP-binding aptamer (YFPapt) (i). Created with BioRender.com. Design BSTV is identical to B but can connect to either an STV-binding aptamer (STVapt) (ii) or a biotinylated DNA oligonucleotide (BiotinDNA) (iii). The templates of protein-binding aptamers (YFPapt-T and STVapt-T) are transcribed in synthetic cells alongside the associated RNA-nanostar templates (AYFP-T and BSTV-T, respectively), while pre-synthesized BiotinDNA is encapsulated alongside template BSTV-T. b, Diagrams (top) and confocal micrographs (bottom) of synthetic cells expressing RNA MLOs in the absence (left) or in the presence (right) of protein-binding moieties for the systems presented in a. When protein-binding aptamers are expressed or the biotinylated DNA oligonucleotide is included, target proteins are recruited in the MLOs. Scale bars, 50 μm (top) and 150 μm (bottom). c, Protein partitioning parameter, ξ, calculated from confocal micrographs in b as the ratio between the fluorescence signal of the target proteins recorded within and outside the MLOs for individual synthetic cells (Supplementary Methods 3). Data are shown for the three systems in a and b, with and without protein-binding moieties. In the box plots, the central line marks the median, the box marks the Q1 (first quartile) – Q3 (third quartile) interquartile range (IQR) and the whiskers enclose data points within Q1 − 1.5 × IQR and Q3 + 1.5 × IQR. Data points are relative to individual synthetic cells from a single field of view of one imaged sample ((i), (ii) and (iii), left) or two fields of view from two technical replicates ((iii), right). All data points are shown except for four outliers with ξ > 5 in (i) and (iii), omitted for ease of visualization.

