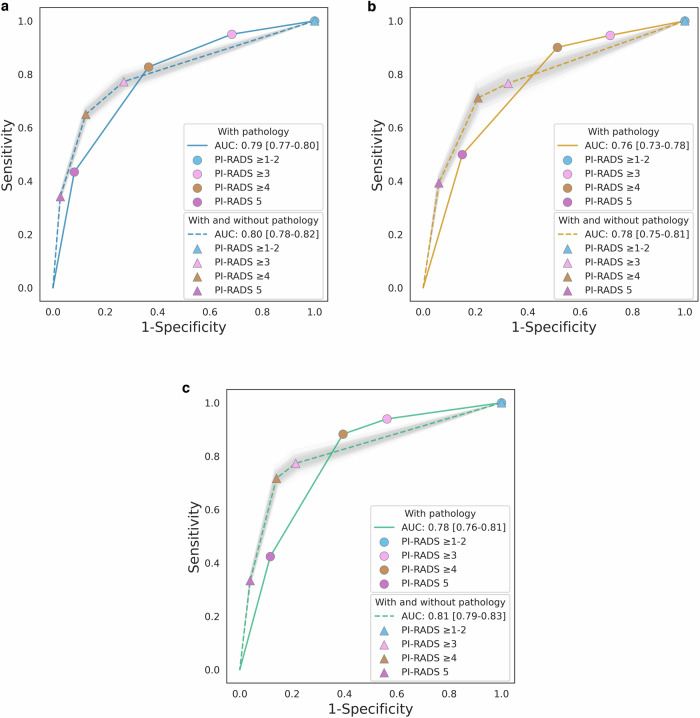
Fig. 4.
Observed and estimated receiver operating characteristic curves. a Facility I. b Facility II. c Facility III. The colored lines represent the receiver operating characteristic (ROC) curves in patients with pathological confirmation, while the same color dotted lines represent those in patients with and without pathological confirmation. Light gray areas represent the distribution of the ROC curves for each bootstrap repetition. The area under the ROC curve was shown with the 95% confidence interval in square brackets. The 95% confidence interval was calculated using the percentiles of the bootstrap distribution. AUC, area under the receiver operating characteristic curve; PI-RADS, Prostate Imaging-Reporting and Data System

