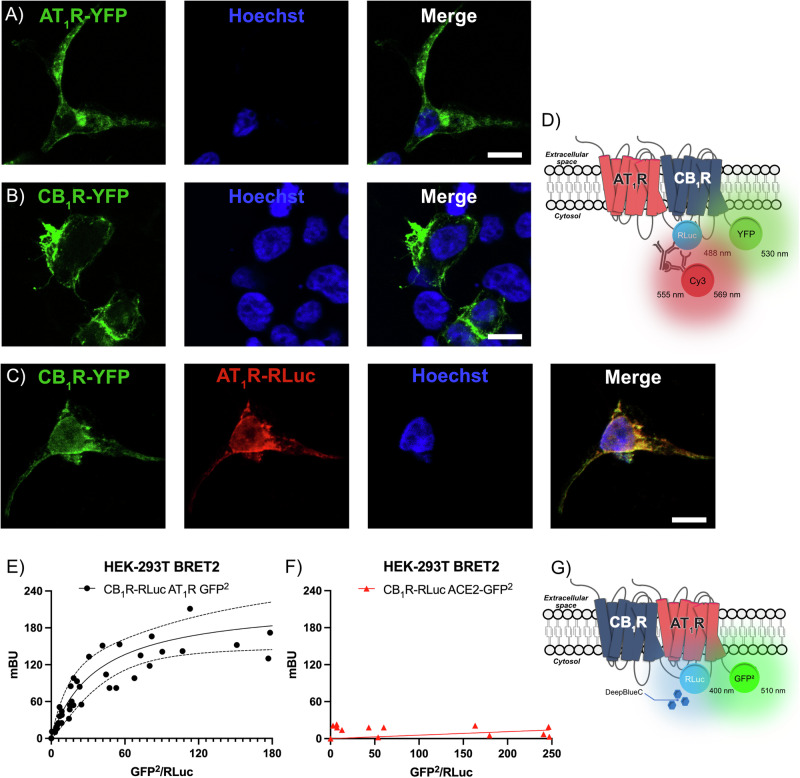
Fig. 2. Immunocytochemistry and BRET assays.
Immunocytochemistry in HEK-293T cells expressing AT1R-YFP (A), CB1R-YFP (B) or coexpressing AT1R-Rluc and CB1R-YFP (C). The Rluc-containing fusion protein was detected using a mouse monoclonal anti-Rluc antibody and a secondary Cy3-conjugated anti-mouse IgG antibody (red). Cell nuclei were stained with Hoechst 33342. Colocalization is shown in yellow (C). Confocal images were obtained at lower planes, where the plasma membrane extends on the glass of the slide. Scale bar: 15 µm. Scheme of the immunofluorescence detection (D). Bioluminescence resonance energy transfer BRET2 assays were performed in HEK-293T cells transfected with a constant amount of cDNA for CB1R-Rluc (0.2 μg) and increasing amounts of cDNAs for AT1R-GFP2 (0.5–4.5 μg) (E) or ACE2-GFP2 (0.25–2 μg) (F, negative control). The values shown in each graph were obtained from data from six independent experiments. G Scheme of the BRET2 assay.

