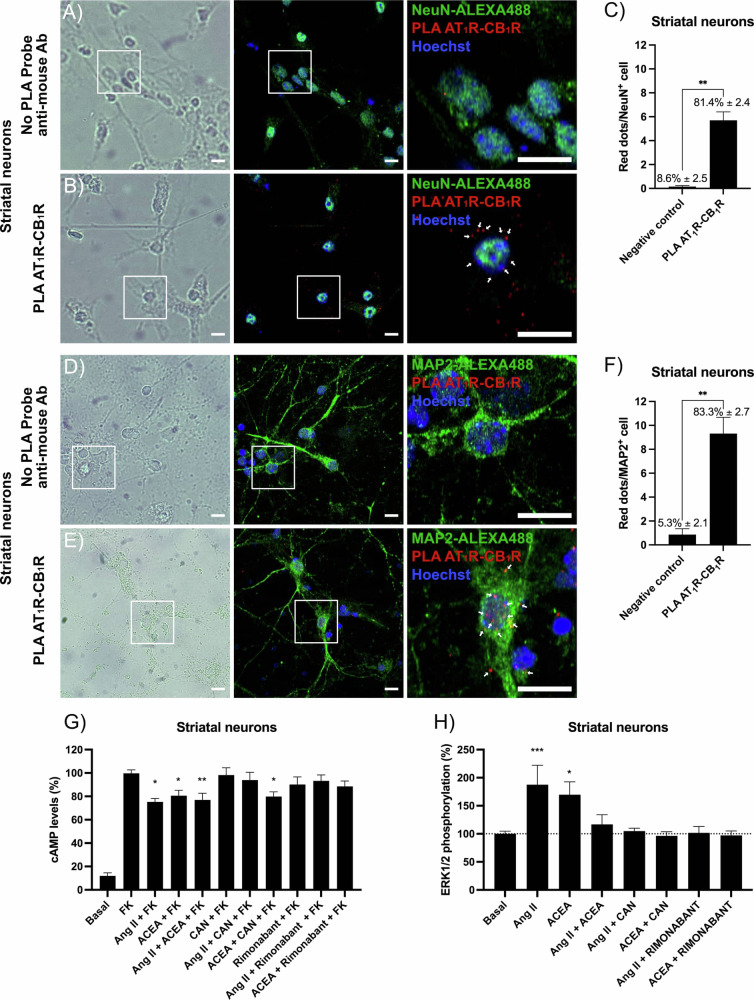
Fig. 4. AT1R-CB1R heteromer expression and functionality in primary striatal neurons.
A–F In situ proximity ligation assays were performed in primary neurons using specific primary anti-AT1R (1:100) and anti-CB1R (1:100) antibodies. Cell nuclei were stained with Hoechst 33342 (blue); AT1R-CB1R receptor complexes appear as red dots (B, E; white arrows in the image on the right). An Alexa Fluor® 488 conjugated anti-NeuN antibody (1:200) or Alexa Fluor® 488 conjugated anti-MAP2 (1:200) were used to locate red dots in neurons. Bright-field images are shown in the left panels. Representative images corresponding to stacks of four sequential planes are shown. Scale bar: 15 µm. The number of red dots/NeuN+ cells (bar graph, C) or red dots/MAP2+ cells (bar graph, F) was quantified using a specifically designed pipeline of Cellprofiler™ (see “Methods” section and Supplementary Fig. S2). The percentage ± S.E.M. of neurons with at least one detected red dot out of the total number of quantified neurons is expressed above each bar. G, H Neurons were pretreated for 15 min with ligand solvent (vehicle) or selective antagonists: candesartan for the AT1R or rimonabant for the CB1R. Cells were then treated for 15 min with Ang II, ACEA or both. For cAMP level determinations assays (G), cells were treated for an additional 15 min with FK (0.5 μM). Values are expressed as the percentage of cAMP accumulation induced by FK. Statistical analysis was performed using one-way ANOVA followed by Bonferroni’s post-hoc test (*p < 0.05, **p < 0.01; versus FK condition to determine significant decreases in cAMP levels). ERK1/2 phosphorylation determination assays were performed as described in “Methods” section; values were normalized by considering 100% the phosphorylation level obtained in the absence of agonists (basal) (H). Values are the mean ± S.E.M. of five different experiments performed in triplicates. Statistical analysis was performed using one-way ANOVA followed by Bonferroni’s post-hoc test (*p < 0.05, ***p < 0.001; versus basal condition to determine significant increases in ERK1/2 phosphorylation).

