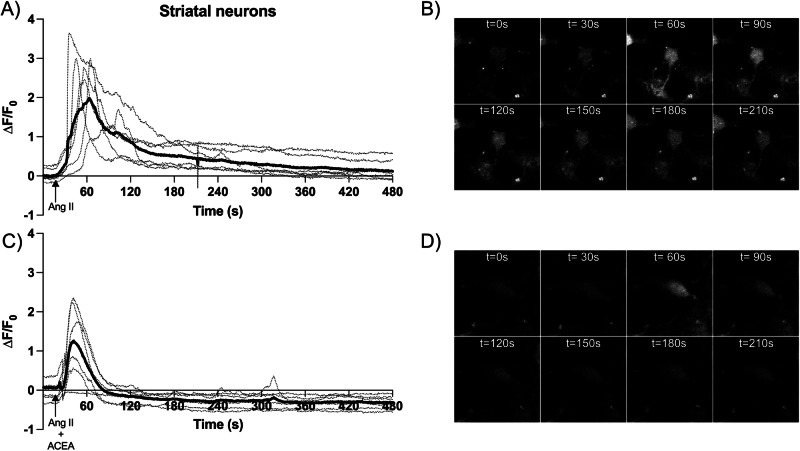
Fig. 5. Measurement of cytosolic [Ca2+] in striatal neurons loaded with Fluo-4 NW.
Baseline fluorescence (F0) was established with 15-s frames taken before adding the receptor ligands: 100 nM Ang II (A) or 100 nM Ang II plus 100 nM ACEA (C). Frames were captured at the maximum allowed speed (600 ms) by a Zeiss LSM 880 confocal microscope. Each ∆F/F0 versus time dashed curve in (A) and (C) corresponds to a single neuron; the solid black ∆F/F0 versus time curves in (A) and (C) result from averaging the readings of all neurons labeled within the ROI. Background fluorescence (FB) was estimated by measuring fluorescence in “empty” spaces. Time series fluorescence images in (B) and (D) correspond to those qualitatively displayed in, respectively, (A) and (C). Data from a representative experiment are shown.

