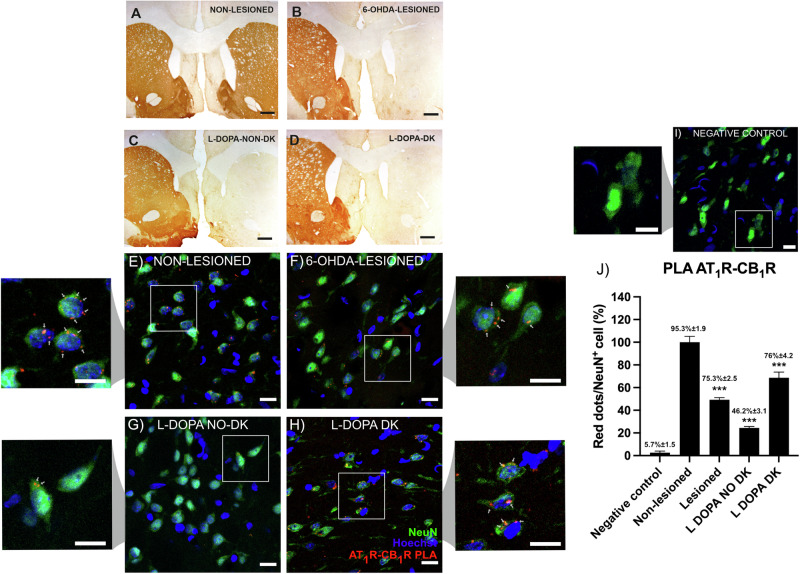
Fig. 6. AT1CB1Het expression in NeuN+ cells of striatal sections of control and lesioned rats.
Tyrosine hydroxylase (TH) immunoreactivity in the striatum of (i) a control animal (A, non-lesioned), (ii) an animal with unilateral dopaminergic denervation in the right side (B, 6-OHDA lesioned), (iii) a lesioned animal treated with levodopa non becoming dyskinetic (C, l-DOPA-NON-DK) and (iv) a lesioned animal becoming dyskinetic upon levodopa treatment (D, l-DOPA-DK); images show a >95% -maximal- lesion in all animal groups (see “Methods” section for details). Scale bar = 500 µm. PLA assays were performed in samples from all groups. Confocal microscopy images (stacks of five consecutive planes) show AT1CB1Het complexes in all samples analyzed; they appear as PLA signals (red fluorescence dots) surrounding Hoechst-stained nuclei (blue). To determine whether the red dots were in neurons, Alexa-488-conjugated anti-NeuN antibodies were used (E–H). Images of the negative control, samples in which one of the oligonucleotide probes was omitted, are shown in (I) Scale bar = 20 µm. Bar graphs showing the percentage of red dots/NeuN+ cell are in (J). Data are normalized by considering AT1CB1Hets expression in non-lesioned rats (100% refers to the number of AT1CB1Het per NeuN+ cell in samples from non-lesioned animals). One-way ANOVA and Bonferroni’s post-hoc were used to compare the red dots/cell values (***p < 0.001, versus non-lesioned condition). The percentage of NeuN+ cells displaying at least one red dot ± S.E.M. is presented above each bar graph.

