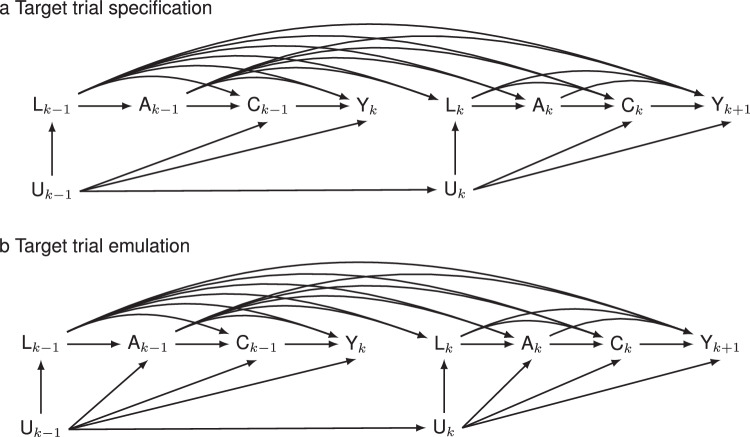
Fig. 6. Causal diagrams of target trial specification and emulation.
Causal graphs illustrate the effects of the treat-to-target cholesterol-lowering interventions () on cardiovascular disease, all-cause mortality, and atherosclerotic cardiovascular disease () in the presence of competing events () using the sequentially randomized trial (the upper panel, i.e., target trial specification, a in which the intervention strategy only depends on prior cardiovascular risk profiles (), cholesterol levels and intervention history () at each time and the hypothetical pragmatic trial (the bottom panel, i.e., target trial emulation, b in which depends on prior , , and the potential unmeasured confounders . and indicate the competing events at time interval and the outcome of interest at time interval , respectively.

