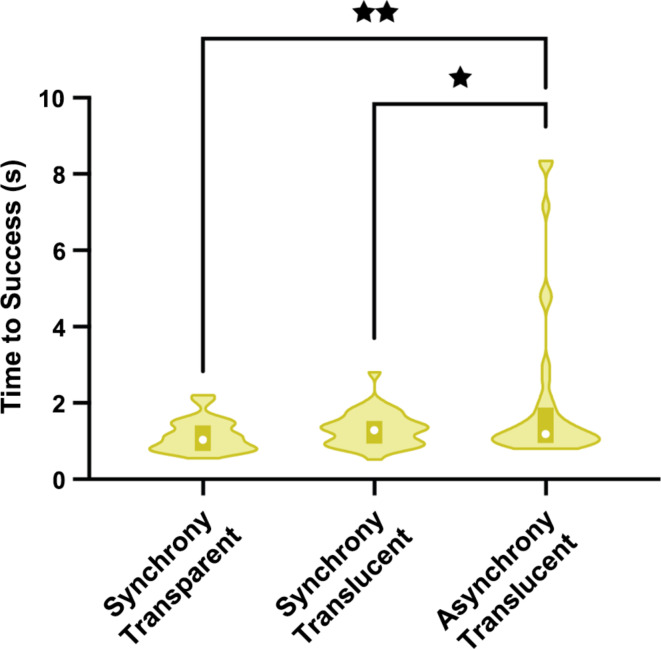
Fig. 1.
Cooperative give-and-take task: Time to success as a function of treatment group. Violin plots showing the duration (in seconds) of time to success as a function of treatment group. Higher values indicate it takes a longer time to succeed on this task, i.e., poorer performance. For each group, the plot spans the data range (lower extent corresponds to minimal value and upper extent to maximal value), with the white circle indicating the median and the bottom and top edges of the shaded rectangle indicating the first and third quartiles, respectively. * p < 0.05. ** p < 0.01.

