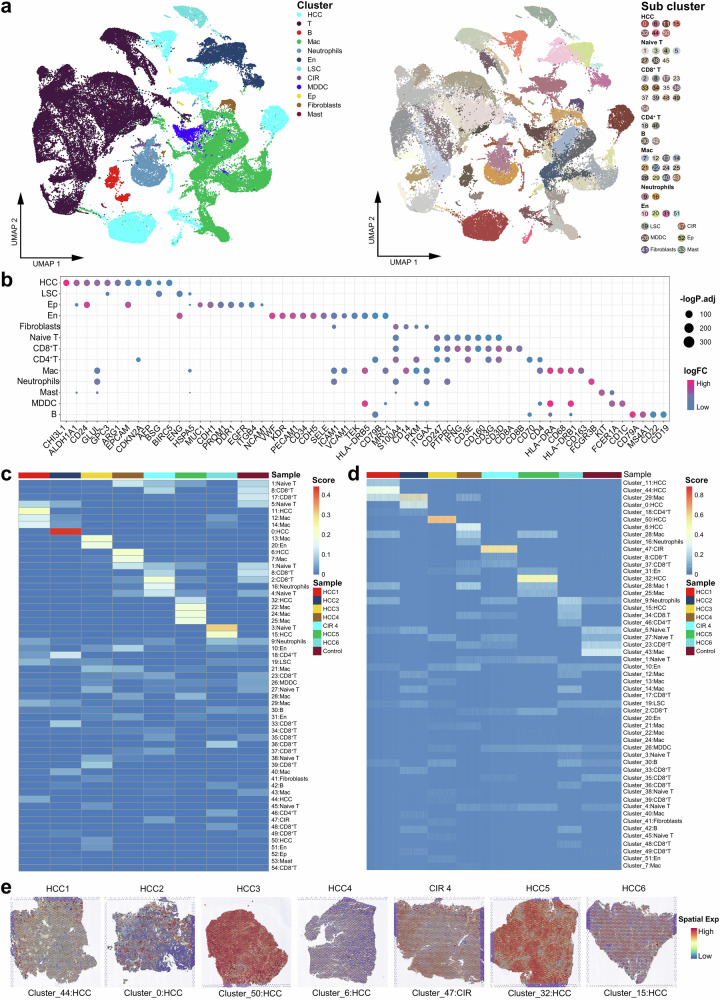
Fig. 2. Spatiotemporal globe landscapes of the ecosystem in HCC, cirrhosis, and non-carcinoma liver.
a Uniform Manifold Approximation and Projection (UMAP) plot showing the cell types in all the study samples, with different color codes denoting different cell clusters (left) and subclusters (right). b Bubble chart showing the specific markers of each cell cluster. c Heatmap representing the proportions of different cell types of each study sample at the single-cell level. d Heatmap representing the proportions of different cell types of each study sample on the spatial resolution. e Spatial feature plot showing the specific cell clusters of each HCC and CIR lesion. See also Supplementary Fig. 1.

