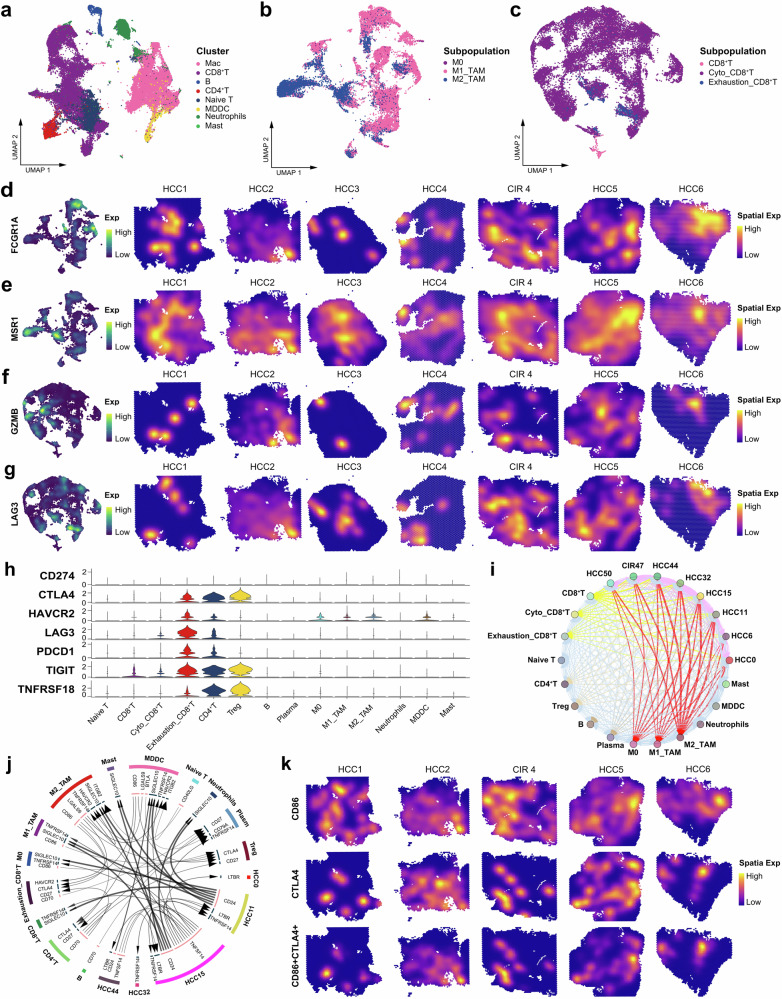
Fig. 4. Spatiotemporal characteristics of the immune microenvironment in HCC and cirrhosis.
a UMAP plot showing the immune cell clusters in all the study samples, labeling in different colors. UMAP plot showing the subpopulations of macrophages (b) and CD8+ T cells (c) in all the study samples, labeling in different colors. UMAP plot and spatial feature plot showing the visualized distribution of specific markers for M1-TAMs (d) and M2-TAMs (e). UMAP plot and spatial feature plot showing the visualized distribution of specific markers for cytotoxic CD8+ T cells (f) and exhausted CD8+ T cells (g). h Violin plot showing the expression of immune checkpoints molecules on each immune cells. i Bubble plot showing the intercellular communications among HCC cell, CIR cell, and immune cell subpopulations, with each bubble denoting the cell identity and line thickness denoting the strength of intercellular interactions. j Circos plot showing the Intercellular communication network of HCC cell, CIR cell, and immune cell subpopulations with a high confidence level, with each arrow denoting the interaction between the source cell ligand and target cell receptor, and the arrow thickness denoting the number of ligand-receptor interaction pairs. k Spatial feature plot showing the distribution of the co-expression of CD86, CTLA4, and CD86+CTLA4. See also Supplementary Fig. 2, Supplementary Table 2 and Supplementary Table 3.

