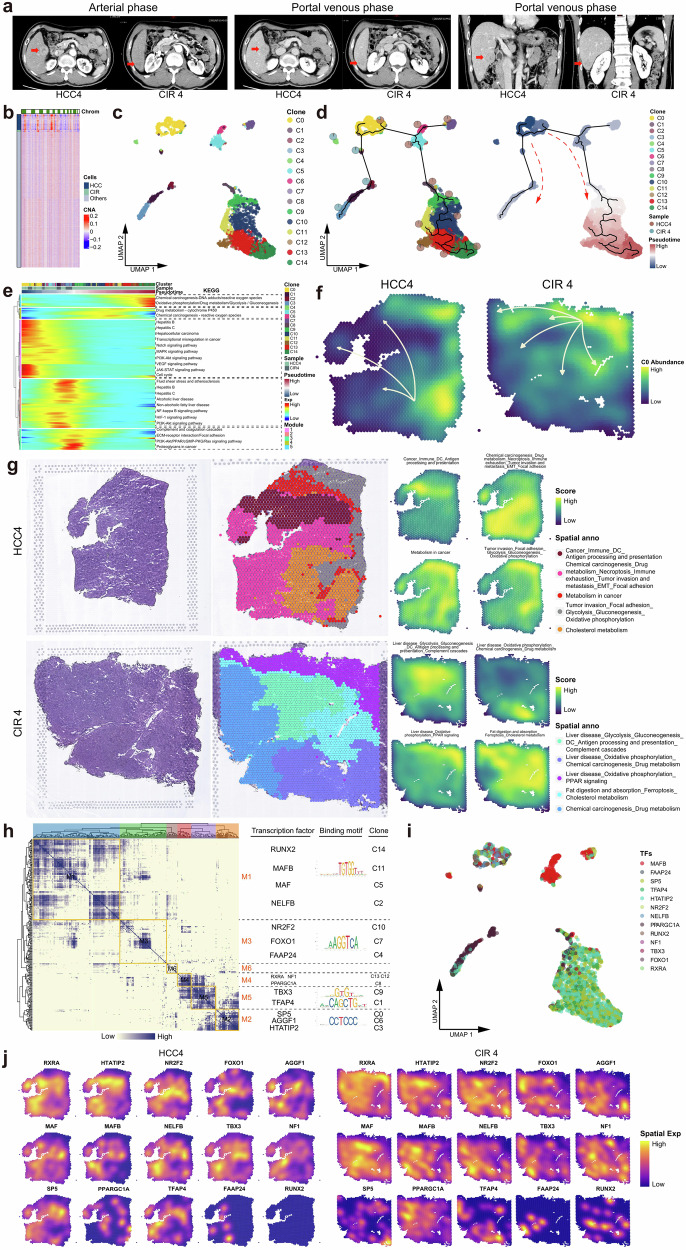
Fig. 5. Parallel patterns of the evolution between HCC and cirrhosis.
a Contrast-enhanced CT images of simultaneous HCC and CIR lesions in Patient #4. b Heatmap profiling the chromosome copy number variation (CNV) of HCC, CIR, and other cells of Patient #4. c UMAP plot showing the subclusters of HCC4 and CIR4 cells, labeling in different colors. d UMAP plot showing the pseudo-time series evolutionary patterns of the subclusters of HCC4 and CIR4. Pie chart showing the proportions of HCC4 and CIR4 cells in each subclusters. Pseudo-time values (low to high) indicating the direction of sub-clonal evolution. e Heatmap representing the pseudo-time series of changes of differentially expressed genes in HCC4 and CIR4 subclusters. These genes were clustered into five modules, with each module participating in significantly different pathways. f Spatial feature plot showing the evolution patterns of HCC4 and CIR4 subclusters, with arrows indicating the direction of evolution. g H&E staining (left), and spatial cluster distribution of section (middle) labeled by colors, and density plots of specific gene sets of spatial cluster (right) for the HCC4 and CIR4, defined into different spatial blocks. (h) Heatmap representing the gene regulatory networks (GRNs) of HCC4 and CIR4 subclusters. Left: Identification of regulon modules based on the connection specificity index (CSI) matrix of regulons; Middle: Representative transcription factors (TFs) of modules and their binding motifs; Right: Relationships of modules with the HCC4 and CIR4 subclusters. i UMAP plot identifying the TFs that regulate HCC4 and CIR4 cell subclusters. j Spatial feature plot showing the distribution of TFs that regulate the HCC4 and CIR4 subclusters. See also Supplementary Table 4 and Supplementary Table 5.

