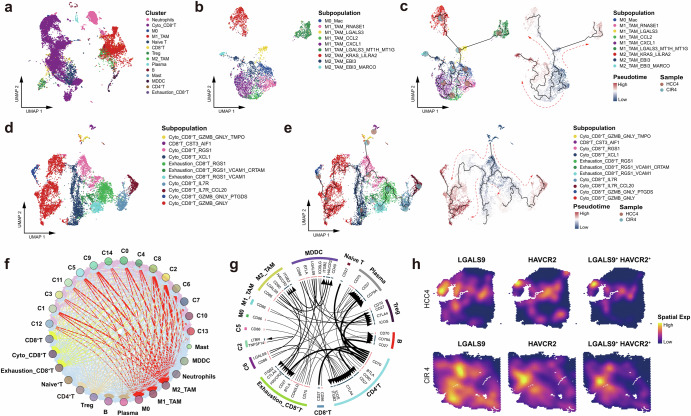
Fig. 6. Dynamic reprogramming of the immune microenvironment accompanying the evolution of HCC and cirrhosis.
a UMAP plot showing the immune cell clusters of HCC4 and CIR4, labeling in different colors. b UMAP plot showing the subpopulations of macrophages of HCC4 and CIR4, labeling in different colors. c Pseudo-time series of macrophages polarization in HCC4 and CIR4, Macrophages subpopulations are labeled by colors. Pie chart showing the proportion of macrophage subpopulations. d UMAP plot showing the CD8+ T cell subpopulations of HCC4 and CIR4, labeling in different colors. e Pseudo-time series of CD8+ T cell states in HCC4 and CIR4. CD8+ T cell subpopulations are labeled by colors. Pie chart showing the proportion of CD8+ T cells subpopulations. f Bubble plot showing the intercellular communications among the HCC cell, CIR cell, and immune cell subpopulations, with each bubble denoting the cell identity and line thickness denoting the strength of intercellular interactions. g Circos plot showing intercellular communication network of each HCC cell, CIR cell, and immune cell subpopulations with a high confidence level, with each arrow denoting the interaction between the source cell ligand and the target cell receptor, and the arrow thickness denoting the number of ligand-receptor interaction pairs. h Spatial feature plot showing the distribution of the co-expression of LGALS9, HAVCR2, and LGALS9+HAVCR2 in HCC4 and CIR4. See also Supplementary Fig. 3, Supplementary Table 6 and Supplementary Table 7.

