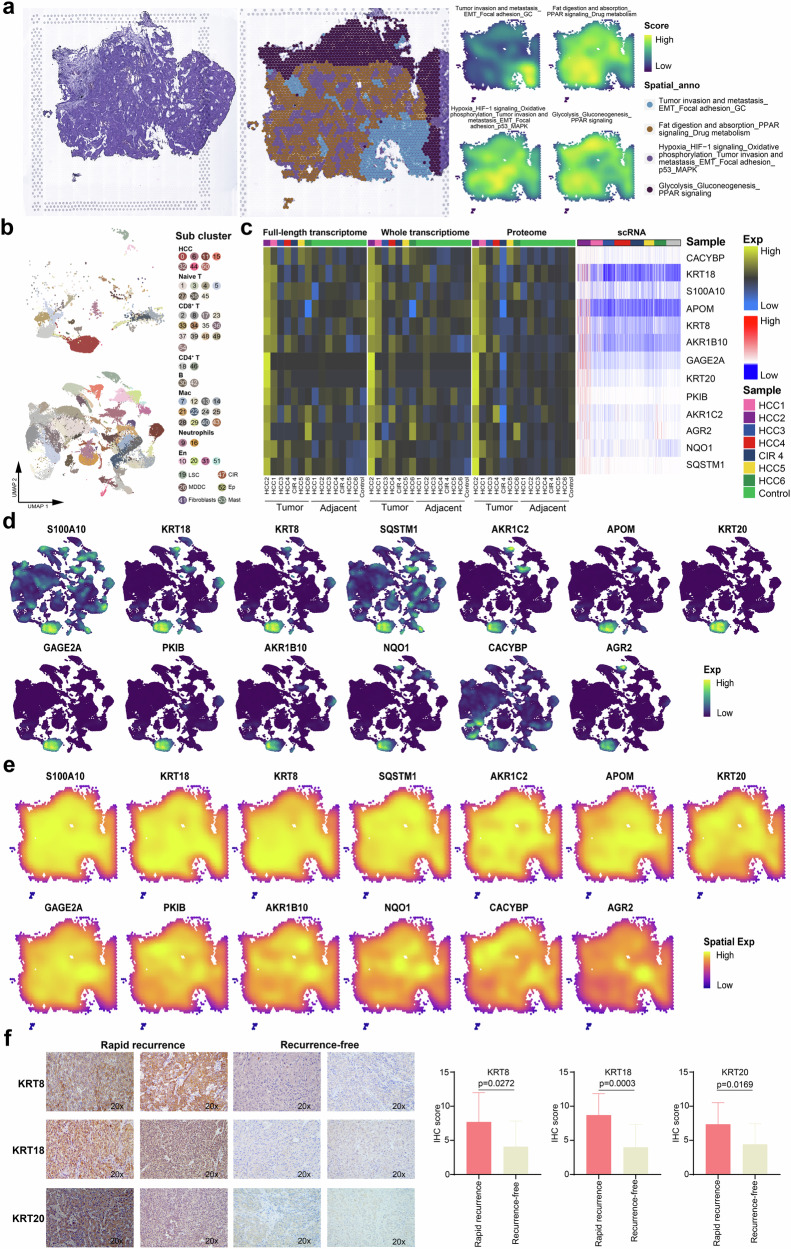
Fig. 8. Ecological niche of early HCC recurrence.
a H&E staining(left), and spatial cluster distribution of section (middle) labeled by colors, and density plots of specific gene sets of spatial cluster (right) for HCC2, defined into different spatial blocks. b UMAP plot showing the cell subclusters of HCC2 (top) and other tissues (bottom), labeling in different colors. c Heatmap representing the expression of ecological niche genes of HCC recurrence at the full-length transcriptome, whole transcriptome, proteome, and single-cell RNA levels. d UMAP plot showing the distribution of ecological niche genes of HCC recurrence. e Spatial feature plots showing the distribution of the ecological niche genes of HCC recurrence in HCC2. f Immunohistochemical staining showing increased KRT8, KRT18, and KRT20 expressions in the resected tumors originated from the rapid recurrence HCC patients compared to the recurrence-free HCC patients, original magnification, ×200. See also Supplementary Fig. 5.

