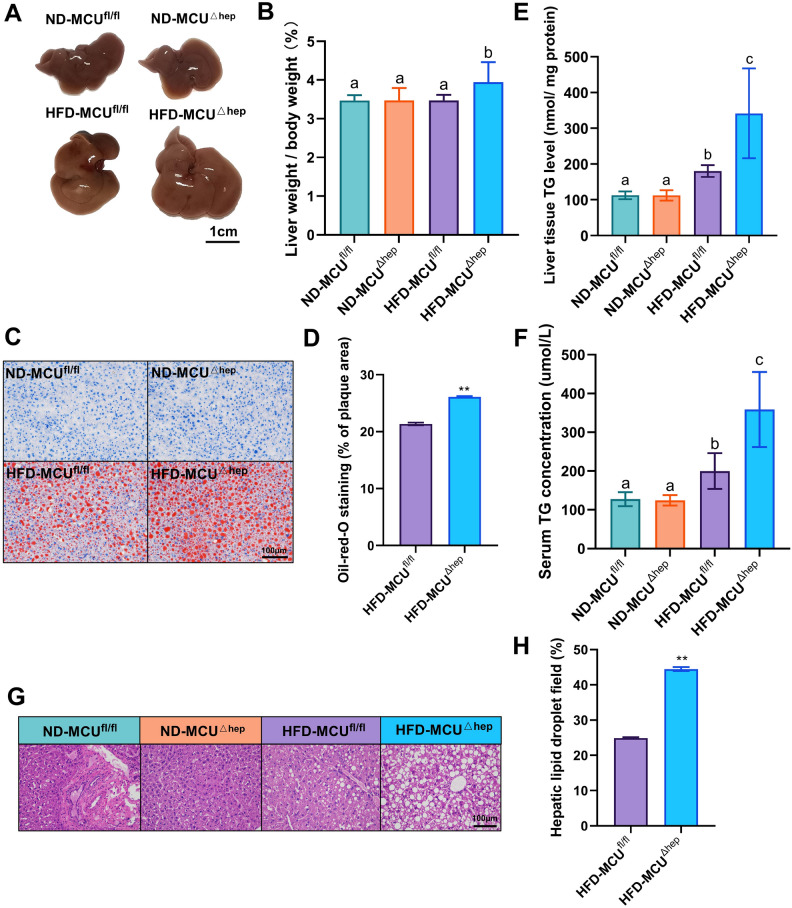
Fig. 3.
Liver-specific knockout of MCU leads to an elevation in HFD-induced hepatic steatosis (n = 6). (A) Representative liver tissue photographs; Scale bar: 1 cm. (B) Liver weight-to-body weight ratio in different groups of mice. (C) Liver oil red O staining analysis images; Scale bar: 100 µm (40× objective). (D) Quantification of oil red O staining. (E) Hepatic triglyceride (TG) concentration. (F) Serum triglyceride concentration. (G) Representative liver H&E staining analysis images; Scale bar: 100 µm (40× objective). (H) Quantification of HE staining. All results are presented as means ± SD, with *p < 0.05/**p < 0.01 indicating statistical significance. Different letters meant there was significant difference among groups (p < 0.05).

