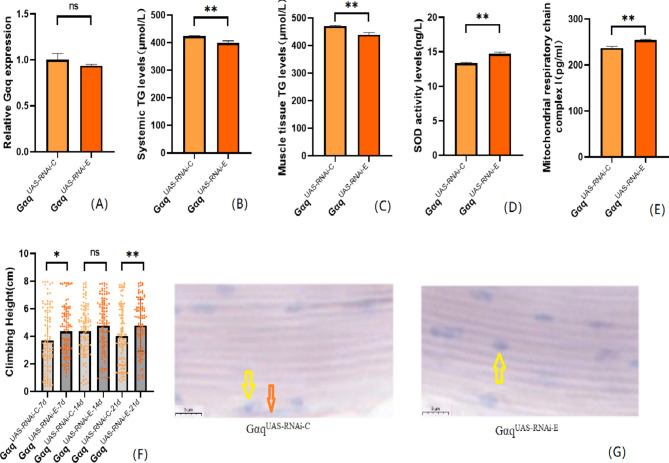
Fig. 5.
After endurance exercise intervention, Gαq normally expressed related gene expression, lipid metabolism level, oxidation capacity, mitochondrial function and 3s climbing ability of Drosophila melanogaster. (A) Relative expression of Gαq, Sample n = 50. (B) Whole Body Triglyceride Levels, Sample n = 20. (C) Muscle Tissue Triglyceride Levels, Sample n = 30. (D) SOD activity levels, Sample n = 30. (E) Mitochondrial respiratory chain complex I content, Sample n = 30. (F) Climbing height, Sample n = 100. (G) Oil red staining, Sample n = 5. Yellow arrows indicate nuclei and orange arrows indicate lipid accumulation (scale: black line is 5 μm). The one-way analysis of variance (ANOVA) with least significant difference (LSD) tests was used to identify difference among the groups. Data are represented as mean ± standard deviation. *P < 0.05; **P < 0.01; n s means no significant difference.

