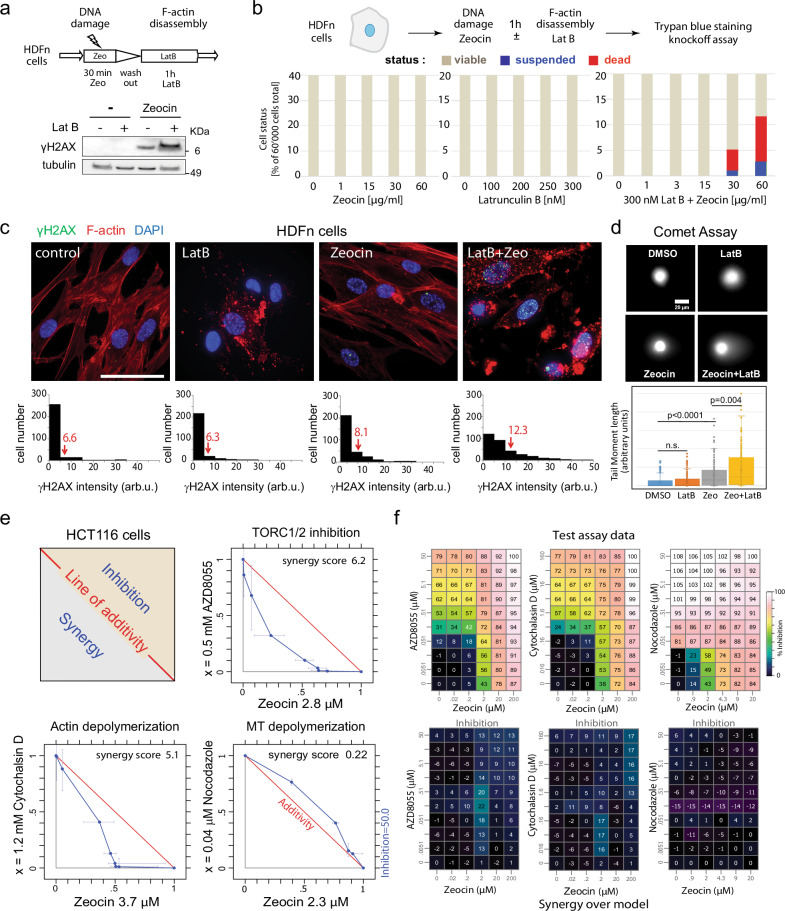
Fig. 2. Actin depolymerization is synthetically lethal with Zeocin in cultured human cells.
a Experimental flow. b Primary human dermal fibroblasts (HDFn; Life Technologies) were incubated 1 h ± 50 μg/ml Zeocin, washed, then cultured 1 h ± 300 nM LatB. Total protein extracts were probed for α-γH2AX (Merck-Milipore JBW301) and α-tubulin (Abcam ab6161) by western blot. Full blots of duplicate experiments are in Source data. b Synergistic lethality from Zeocin and LatB. HDFn cells (60,000 per sample) were incubated 1 h with indicated titrations of Zeocin, LatB, or in Zeocin +300 nM LatB. Dead cells (Trypan blue+) and suspended cells (Trypan blue-) were scored by BIO-TC20 (BioRad). c HDFn cultures were supplemented with SiR-actin (2 μM) to visualize actin, and treated 1 h with LatB (300 nM), Zeocin (60 μg/ml), or both. Fixed cells immunostained for γH2AX (green, see a), F-actin (SiR-actin, red), and DAPI (blue) were imaged and γH2AX intensity (arbitrary units) was measured by ImageJ for control cells (n = 294), LatB (n = 252), Zeocin (n = 299), and both (n = 323 cells). Arrows indicate mean intensities. Bar = 25 μm. d Alkaline Comet assay monitors ss and ds breaks in HDFn cells after 4 h on LatB (300 nM), Zeocin (60 μg/ml), or both. Comet tail moments calculated by CASP software98 for ≥200 cells each condition and plotted. Significance was determined by Mann–Whitney rank sum test. Data presented are mean value ±SEM, cells outside 95% confidence. ns = p > 0.05. Raw images uploaded as Source data file. e Inhibition of mTORC1/2 or actin depolymerization reduces HCT116 cell growth synergistically with Zeocin. Human HCT116 cells seeded at 2700 cells/well in 96-well format were treated with titration of Zeocin (x axis) and AZD8055 (mTOR catalytic inhibitor), Cytochalasin D (blocks actin polymerization), or Nocodazole (depolymerizes microtubules; y axes). Proliferation was measured after 96 h using cell titer blue (compound exposure 72 h). Scheme illustrates the isobologram with the red line showing additivity, synergism in lower gray triangle, antagonism in tan, as calculated by a combined chemical genetics method53. Blue line = 50% inhibition as f. f The corresponding average values of growth inhibition (upper panels) and synergy over model for three replicates. Colors = % inhibition; for synergy calculation see ref. 53.

