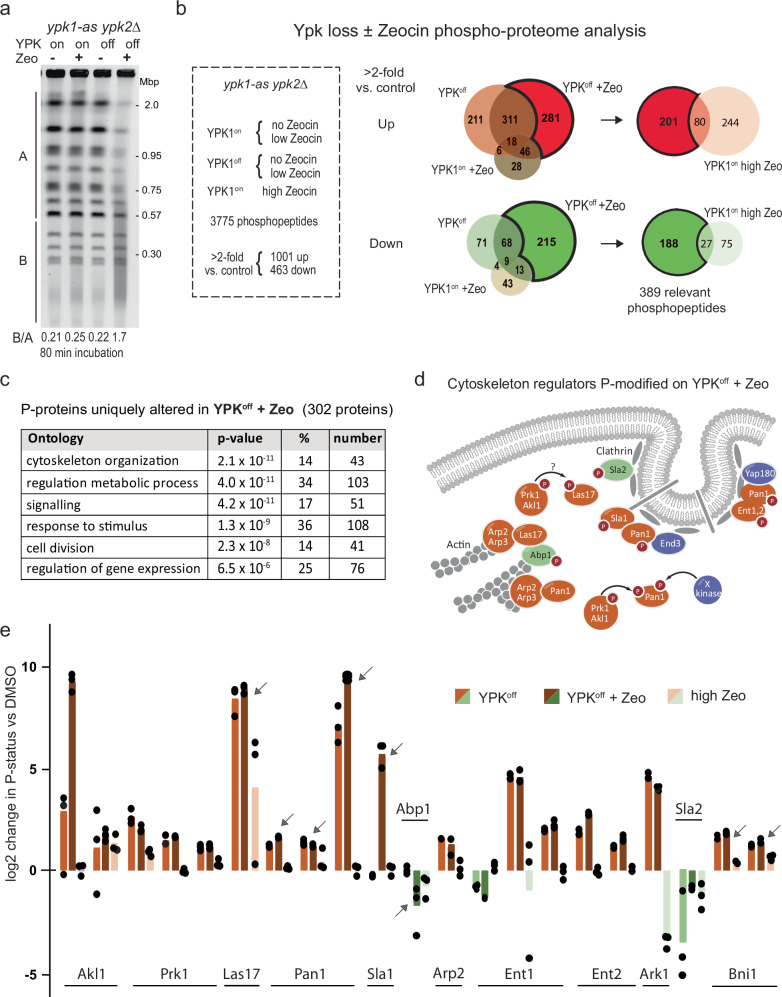
Fig. 3. The YCS phosphoproteome identifies regulators of actin cytoskeleton as major targets.
a Exponentially growing ypk1-as ypk2Δ cells (GA-5893) were treated with 1% DMSO (mock), 75 μg/ml Zeocin (Ypk1on+Zeo), 0.5 μM 1NM-PP1 (Ypk1off), or both for 80 min, and genomic DNA was subjected to CHEF gel analysis as in Fig. 1b. b Treatments as in a, as well as wild-type yeast in 750 μg/ml Zeocin (high Zeo), were for 80 min, performed in triplicate. Extracted proteins were analyzed by label-free mass spectrometry (see Methods58). Phosphopeptides were triaged for change >2-fold vs DMSO control. Venn diagrams show phopshopeptides up (reddish) or down (green tones) in Ypk1off + Zeo vs. Ypk1off or Ypk1on + Zeo. Ypk1off + Zeo-specific targets are darker in the Venn diagrams. From this subgroup we subtracted phosphopeptides altered by Zeocin alone (80 up; 27 down), leaving 201 up- and 188 downregulated phosphopeptides, in 302 proteins. c GO-term analysis of the Ypk+Zeocin-specific phosphoproteome was carried out, and significance was determined vs a total number of factors in yeast in that category using the hypergeometric distribution. Cytoskeletal organization was most significantly enriched. d A cluster of interacting regulators of yeast endocytosis and actin cytoskeleton (image based on64), of which all except two (blue) were recovered as Ypk+Zeocin-sensitive phosphoacceptors. Red-labeled proteins gain phosphorylation, green lose it. e Each bar represents a specific phosphotarget site involved in actin filament regulation and endo- and exocytosis, plotted as log2 change of increased (reddish) or decreased (green) phosphorylation by indicated treatments vs DMSO. Individual values are from biological triplicates; tops of bars are median values. Relevant target sites are: Akl1: S541, S496, S504; Prk1, S553, S556, S560; Las17, T380; Pan1, S1003; S1253 or T1256; S991. T993, T995; Sla1, S449; Abp1, T206; T211; Ent1, T160, T163; T395, T388; Ent2, T468, T470, T479; Ark1. S478; Sla2, T468. T470, T479; Bni1, S325, S327, some defining overlapping phosphopeptides. Arrows indicate proteins studied further.

