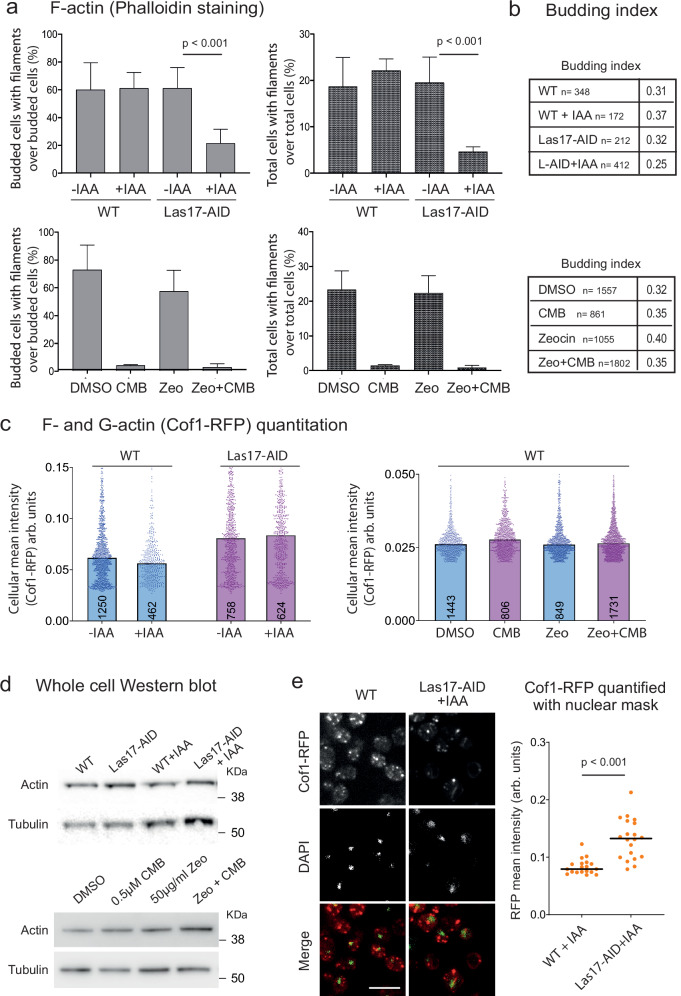
Fig. 6. Las17 degradation and TORC2 inhibition decrease F-actin altering the G-/F-actin ratio.
a Fraction of budded cells or total cells with F-actin filaments was determined after staining with Rh-phalloidin. Exponentially growing cells (GA-5731, AID control; GA-6840, Las17-AID; GA-1981, WT) were treated as indicated (±0.25 mM IAA for Las17-AID and its control, and 50 μg/ml Zeocin ± 0.5 μM CMB for WT), then fixed and stained with Rh-phalloidin. Image examples in Supplementary Fig. 3. Both brightfield and fluorescent images were scored for budding index and cells with filaments by three independent operators on blinded images. Number of cells scored per condition is shown in b. Plots show % budded cells with filaments (left) or % total cells with filaments (right). Data presented as mean value (top of bar) ±SEM. Raw numbers in Source Data file. b Budding index (bud presence) was scored for the same cell populations analyzed in a by three operators on blinded images. Total number cells are same for a, b. Plotting Budded cells with filament/Budded cells excludes cell cycle impact on results. c Yeast strains as a were transformed with a Cof1-RFP (internal tag, Addgene #37102) expression plasmid and treated as above. Cof1-RFP intensity monitors both G- and F-actin and was quantified for each condition with a CellProfiler pipeline. Each dot represents one cell and the number of cells scored range from 402 to 1731, as indicated within each bar. All data points are plotted and top of bar indicates median. By Wilcoxon rank sum test actin levels do not vary significantly ± IAA nor under YCS conditions. d Cells of the samples used in a were collected before fixation. Total protein extracts were subjected to SDS-PAGE and western blotting with validated anti-actin (My BioSource, BSS9231831) or anti-tubulin (Abcam, ab6161). e Scoring nuclear actin detected through Cof1-RFP (expressed as in c) using nuclear masking based on DAPI staining (Fig. 5f) on WT and an isogenic strain lacking Las17 (LAS17-AID + IAA). Samples visualized as c. Bar = 10 μm. In graph of mean (bar = mean values) of n nuclei (n = 19, WT; Mean = 0.8339 ± 0.0131; n = 20 Las17-AID; Mean = 0.1316 ± 0.0340). Based on a two-tailed T test p < 0.0001. Data in Data Source file.

