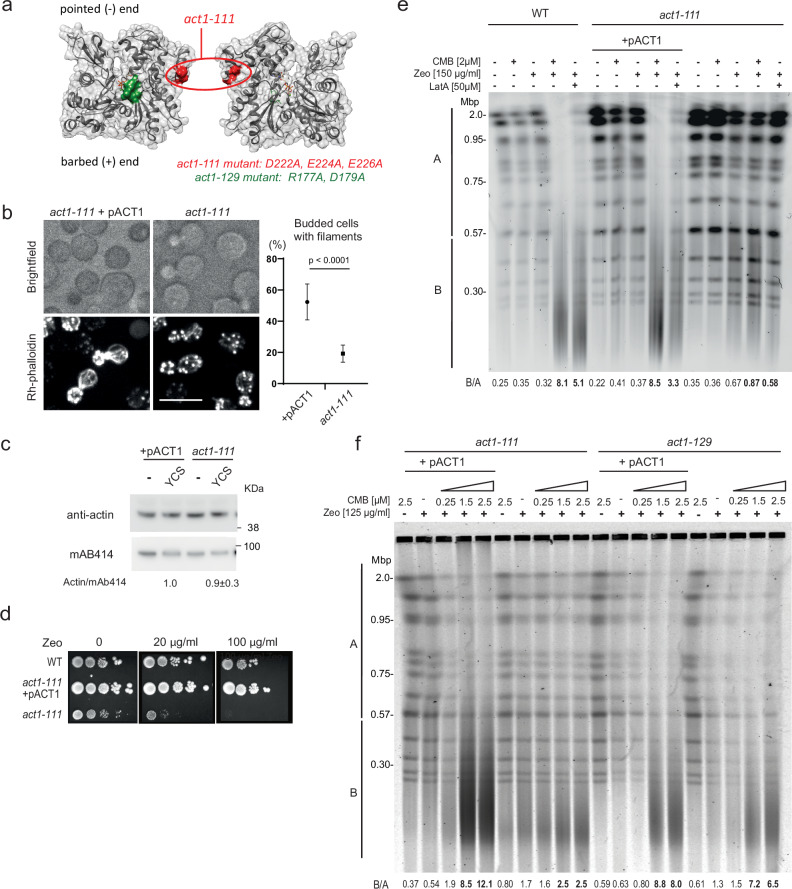
Fig. 7. The act1-111 mutation attenuates TORC2-Zeocin-induced YCS.
a Position of act1-111 (red) and act1-129 (green) mutations77 on an actin monomer shown in two orientations. Filament formation is intact through pointed and barbed ends. b Actin cytoskeleton staining in act1-111 (GA-8592) ±pACT1. Exponentially growing cells were fixed with PFA, stained Rh-phalloidin for 2 h, and imaged. The phalloidin signal in act1-111 expressing pACT1 resembles wild-type, while act1-111 has mostly cortical F-actin patches. Quantitation of actin cables was scored by two blinded operators on three isolates of the act1-111 mutant vs act1-111 + pACT1. n total +pACT1 = 1012, n total act1-111 = 2790; data are presented as mean value ±SEM, by two-tailed unpaired T test, p < 0.0001. Scoring is in Source Data file. Scale bar = 10 μm. c Actin levels are constant under YCS conditions in act1-111 strains. Whole protein extracts from strains grown as in b were analyzed by western for a nuclear pore protein (Mab414, Abcam) and actin (My BioSource). Quantitation reflects four blots scanned by the Typhoon scanner; Actin:Mab414 value on YCS is normalized to +pACT1. d The act1-111 mutant (a) is hypersensitive to Zeocin. 1:10 dilution series of act1-111 ± pACT1 on SC agar plus glucose with indicated Zeocin concentrations. Colonies grew 3 days at 30 °C; performed in triplicate with similar results. e Las17-GFP act1-111 cells (GA-8592) ± pACT1 plasmid are resistant to YCS. An isogenic wild-type background (GA-9247; BY background) and the act1-111 mutant were treated with 2 µM CMB and 150 µg/ml Zeocin for 1.5 h, and genomic DNA was monitored by CHEF gel analysis. Where indicated, 50 µM LatA was added rather than CMB. Gels and quantitation are as Fig. 1b. B/A values show that act1-111 is resistant to CMB and LatA treatment. Experimental repeats (n = 3) include panel f. f Wild-type and act1-111 (GA-8592) and act1-129 cells (GA-8590) ± pACT1 plasmid were treated 1.5 h with Zeocin (125 µg/ml), a titration of CMB (0.25–2.5 μM) or Zeocin and CMB as indicated. Genomic DNA was monitored by CHEF gel, stained, and quantified as Fig. 1b. The act1-111, but not act1-129 cells show less CMB-induced fragmentation. The experiment was repeated three times.

