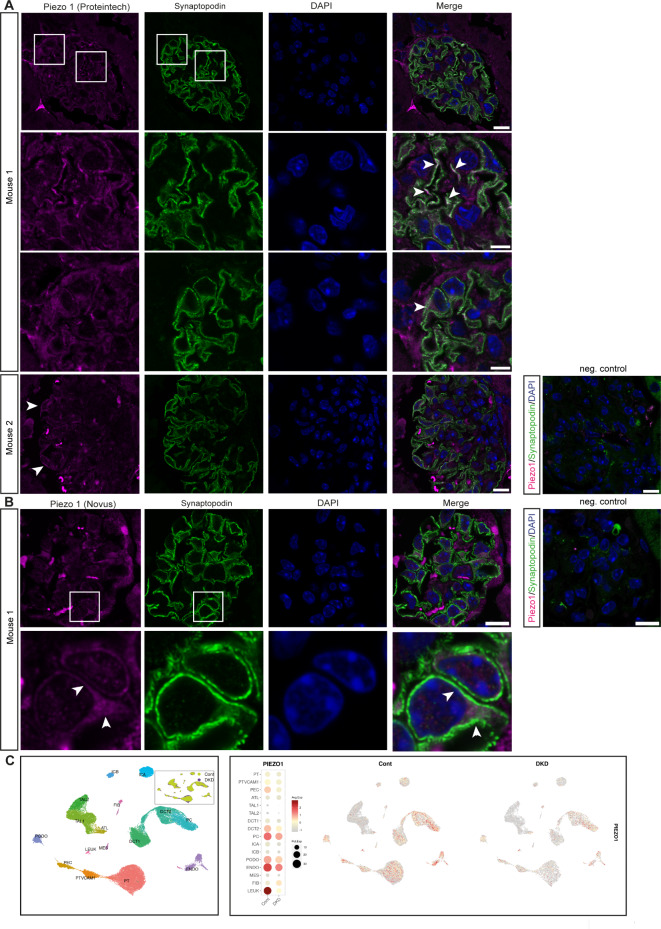
Fig. 1.
Expression of Piezo in mammalian tissue. (A, B) Piezo1 is expressed in mammalian podocytes, which are visualized using the podocyte marker Synaptopodin. Piezo1 is expressed in areas close to the slit diaphragm and in the cell body (arrow heads). Scale bar = 10 μm and 5 μm for the magnification in row 2 and 3 (A) and 10 μm (B). Negative control: without primary antibodies. Scale bar = 10 μm. Antibody used for Piezo1: (A): Proteintech and (B): Novus, see Material and Methods for details. (C) Single nucleus RNAsequencing data from human diabetic kidney disease samples (DKD) and controls reveal Piezo1 expression in podocytes, which decreases in DKD. Data used from the Humphries lab with permission34. PT: proximal tubule, PTVCAM1: VCAM1( +) proximal tubule, PEC: parietal epithelial cells, ATL: ascending thin limb, TAL1: CLDN16(-) thick ascending limb, Tal2: CLDN16( +) thick ascending limb, DCT1: early distal convoluted tubule, DT2: late distal convoluted tubule, PC: principal cells, ICA: type A intercalated cells, ICB: type B intercalated cells, PODO: podocytes, ENDO: endothelial cells, MES: mesangial cells and vascular smooth muscle cells, FIB: fibroblasts, LEUK: leukocytes.

