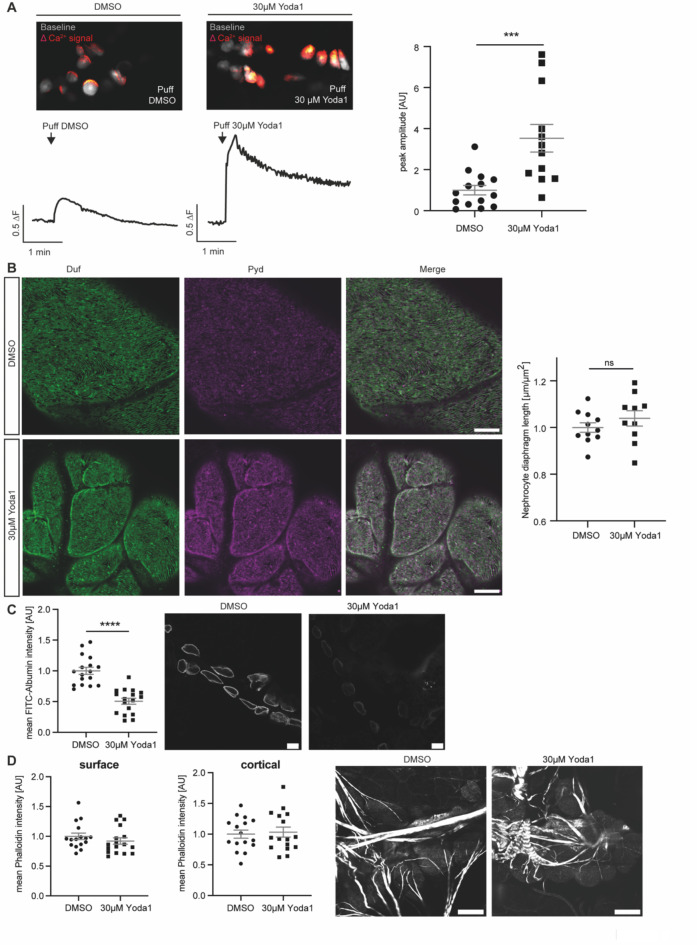
Fig. 3.
Pharmacological activation of Piezo with Yoda1 in adult pericardial nephrocytes. (A) Images of GCaMP6-fluorescent recordings showing puff-induced calcium signals (red) compared to baseline fluorescence (grey) in adult pericardial cells treated with DMSO (left) or 30 µM Yoda1 (right). Below the images are corresponding traces of calcium signal changes over time, following a puff of DMSO (left trace) or 30 µM Yoda1 (right trace). For analysis of GCamP6 intensity, ROIs of single cells have been analysed over time. Fluorescence intensity was then calculated as the mean for each fly and the maximum value within 25 s after puff is depicted as the peak amplitude. Yoda1 treated cells present with a significant increase in calcium signal amplitude after applying force (puff of Yoda1) when compared to DMSO-treated control cells (right). DMSO: 14 flies, 95 ROIs; Yoda1: 12 flies, 101 ROIs. Student’s t-test: ***: p < 0.001. w; sns-Gal4/ + ;UAS-dicer2/UAS-GCaMP6m. (B) 5 min incubation with Yoda1 in combination with applying a mechanical stimulus does not reveal any morphological changes as depicted by immunofluorescence staining with Duf and Pyd antibodies in adult pericardial cells. Scale bar = 5 μm. (C) FITC-Albumin uptake assays reveal a significant difference between controls (DMSO) and Yoda1 treated cells, which have been exposed to a mechanical stimulus (puff). Student’s t-test: ****: p < 0.0001. Scale bar = 25 μm. (D) Visualisation of the actin cytoskeleton with phalloidin does not reveal any changes upon Yoda1 treatment and mechanical stimuli. Scale bar = 25 μm.

