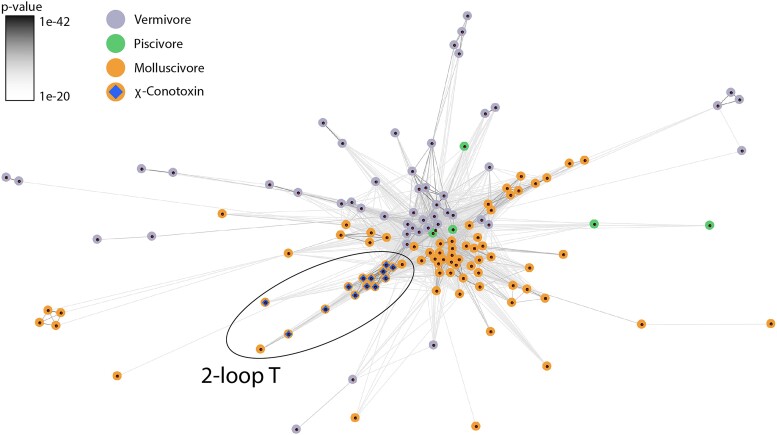
Fig. 3.
BLOSUM62 CLANS cluster map of χ-conotoxins and other T-superfamily toxins. Colored circles represent individual toxin precursor sequences, and the connecting edges show the blastp P-values above 1e−20 between the connected circles. The circles are color coded according to prey preferences (gray: vermivores, green: piscivores, orange: molluscivores). The χ-conotoxins (represented by a blue prism) are all part of a lineage of 2-loop Ts, which are exclusively found in molluscivores.

