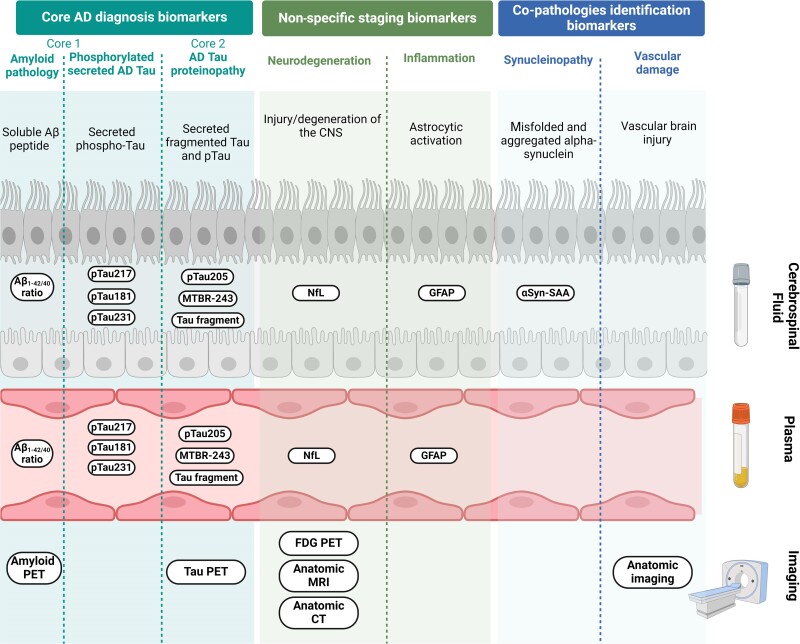
Figure 5.
ATNISV classification and current diagnosis tools for Alzheimer’s disease. The ATNIVS Alzheimer’s disease (AD) diagnosis framework draft suggested in 2023 amend former ATN classification described by NIA-AA. It includes four categories to cover a broader spectrum of the pathophysiological complexity of Alzheimer’s disease and relevant biological and imaging related biomarkers. The Core 1 (‘A’) and Core 2 (‘T’) biomarkers categories reflects Alzheimer’s disease main hallmarks: amyloid build-up and neurofibrillary tangles. The measurement in biofluids of Aβ1–42/40 ratio, secreted phosphorylated tau at positions 181, 217, 231 and 205 as well as tau fragments and specific tau regions such as microtubule binding region-243 (MTBR-243), respectively, characterize amyloid and tau pathology. Within this core AD biomarkers, amyloid and tau-PET imaging are used to visualize aggregates location and spreading. Other divisions includes neurodegeneration (‘N’) and neuroinflammation (‘I’) both reflecting non-specific hallmarks related to disease stage. The ‘N’ category stands for neurodegeneration which can be evaluated using CSF or plasma neurofilament light chain (NfL) protein along with anatomic (MRI, CT) or metabolism [18F]-fluorodeoxyglucose (FDG)-PET imaging. The ‘I’ section refers to neuroinflammation stated through glial fibrillary acid protein measurement in biofluids and specifically associated with astrogliosis. The two last additional categories were thought to map potential coexistent co-pathologies adding to the neurodegenerative burden. Hence, ‘S’ category characterize synucleinopathies entwined with aggregated abnormal alpha-synuclein in CSF evidenced with alpha-synuclein seed amplification assay (αsyn-SAA) and ‘V’ refers to vascular damages which can be examined using anatomic imaging.

