FIGURE 3.

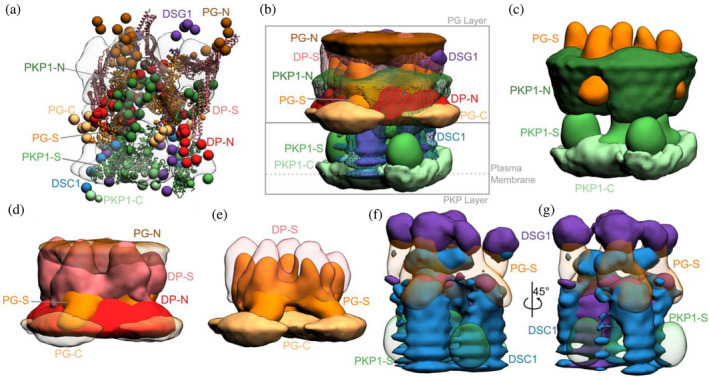
Integrative structure of the desmosomal ODP. (a) The cluster center bead model for the major structural cluster with the cryo‐ET map (EMD‐1703) superimposed in translucent gray. (b) Localization densities of the major cluster. The densities are at a cutoff of approximately 15% for PKP1‐C, PKP1‐S, PG‐S, DP‐S, DSC1, and DSG1 and around 30% for disordered termini regions (PKP1‐N, PG‐N, DP‐N, PG‐C). (c) Localization densities for PKP1 layer (PG‐S density is shown for reference). (d) Localization densities for PG‐layer. (e) The densities for PG‐S and DP‐S with PG‐C as a reference. (f, g) Localization densities for the cadherins. Panel (g) is a rotated view of panel (f). See also Figure 4, Figures S2–S5, Movie S1.
