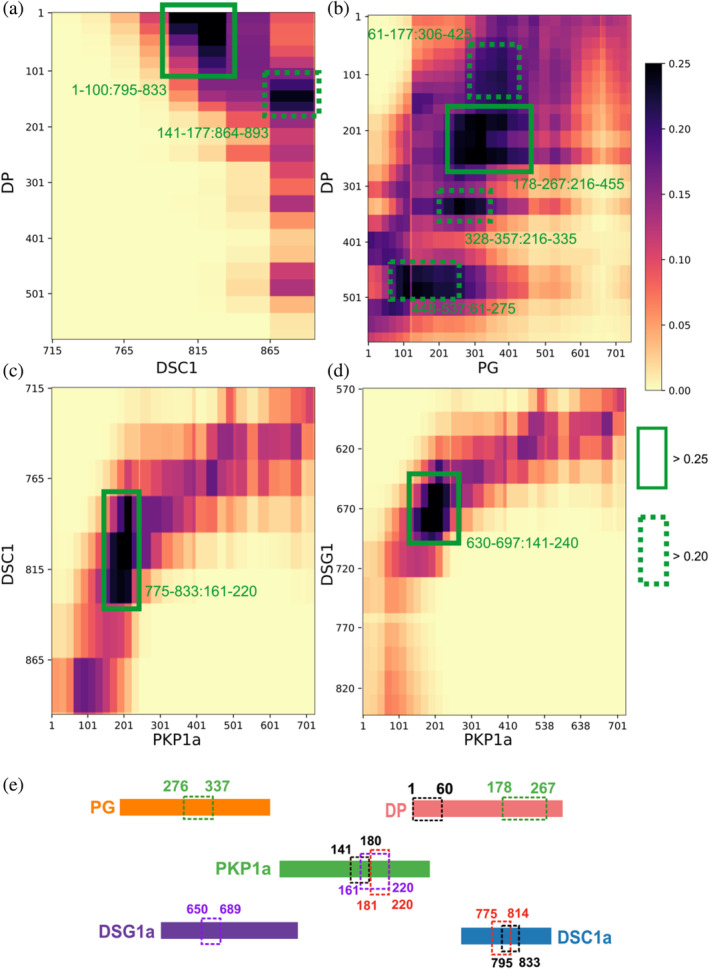
FIGURE 4.

Novel ODP protein–protein interfaces. Protein–protein contact maps for DP‐DSC1 (a), DP‐PG (b), DSC1‐PKP1 (c), and DSG1‐PKP1 (d) pairs. Maps are colored by the proportion of the models in the major cluster where the corresponding bead surfaces are within contact distance (10 Å). Rectangles with solid green (broken green) lines outline novel contacts present in >25% (>20%) of the models. Interacting residues are marked in green text in the format Y‐axis protein residues: X‐axis protein residues. (e) Summary of high‐confidence protein–protein interactions from the integrative model. Dashed rectangles of the same color denote a protein–protein interaction; the interacting residues are marked in the same color. For example, DP 178–267 interacts with PG 276–337 (green rectangle). See also Figure S5, Table S4.
