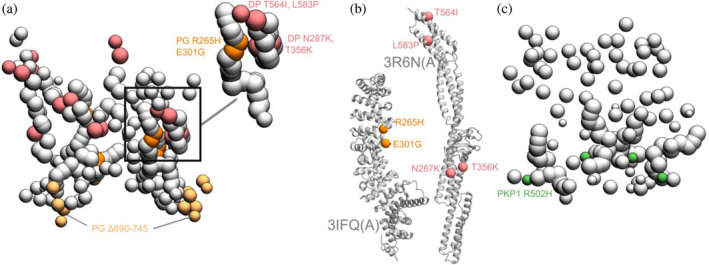
FIGURE 5.

Disease‐associated mutations mapped onto the integrative structure. (a) Cluster center bead model showing mutations in PG and DP. Mutations in DP‐S (pink), PG‐S (orange), and PG‐C (light orange) are colored as per Figure 1. Remaining beads of DP and PG are shown in gray. The top right shows a zoomed‐in version of a novel predicted PG‐DP interface harboring disease mutations. (b) PG‐S and DP‐S mutations mapped onto the corresponding structures 3IFQ(A) and 3R6N(A) (Choi et al., 2009; Choi & Weis, 2011). (c) Bead model showing mutations in PKP1‐S (green). See also Table S5.
