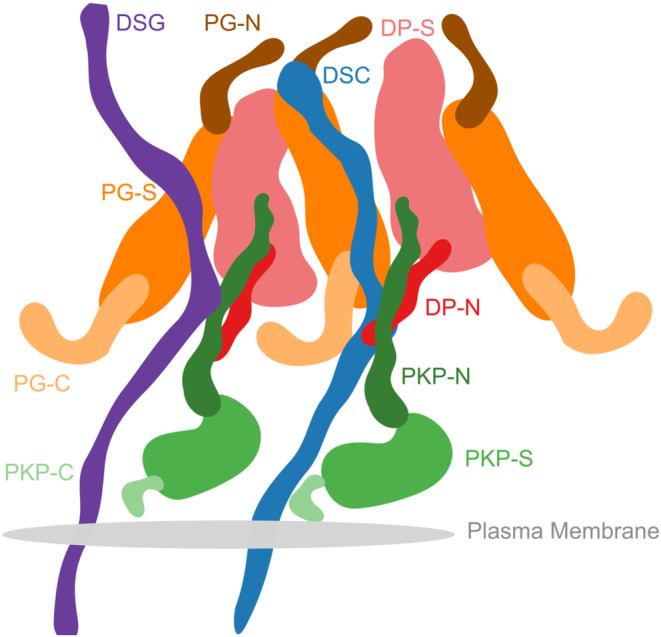
FIGURE 6.

Schematic of the desmosome ODP. Schematic showing the salient features of the protein organization and protein–protein interfaces in the ODP. Wavy thick lines represent potentially disordered regions without known structure (DC, PKP‐N, PG‐N, DP‐N, PKP‐C, PG‐C). Larger shapes represent regions with known structures (PG‐S, DP‐S, PKP‐S). This is an artistic representation of Figure 3.
