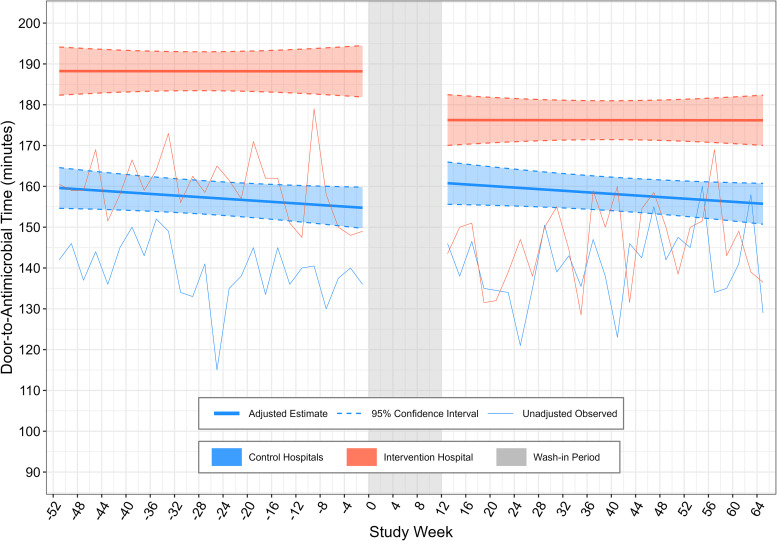
Figure 2.
Adjusted segmented regression analysis for door-to-antimicrobial time. Thin lines represent unadjusted 2-week average of door-to-antimicrobial times for control and intervention emergency departments (EDs). Values are anchored to the midpoint of the 2-week period that they represent. Thick lines represent estimated adjusted door-to-antimicrobial time (with shading indicating the 95% confidence interval) for a typical patient, defined by the median or most common categorical value for model covariates. Study Week 0 is the week during which the Code Sepsis protocol was implemented at the intervention hospital. The postintervention wash-in period is indicated in gray.

