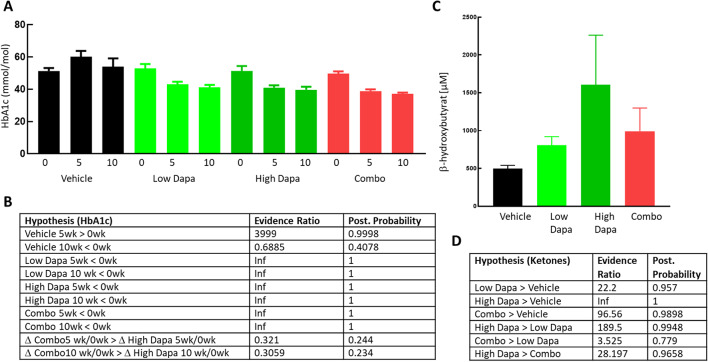
Fig. 2.
Glucose control and ketone levels in mice. HbA1c levels in ob/ob mice at base line and after 5 and 10 weeks treatment (A) for the treatment groups (n = 18 in each group) as indicated. Values for each individual animal are indicated as symbols together with average +/- SEM for each group at each time point. Evidence ratio and posterior probability based on Bayesian statistics for the indicated hypothesis for the HbA1c (B) and ketone data (D) The 2 lower lines in (B) show the parameters for the hypothesis that the change in HbA1c from baseline after 5 weeks Combo treatment (D Combo5 wk/0wk) is larger than the change for HbA1c during high Dapa treatment (D High Dapa 5wk/0wk) and analog after 10 weeks in the last row. (C): β-hydroxybutyrate (average +/- SEM) plasma concentrations at termination for the 4 different treatment groups as indicated

