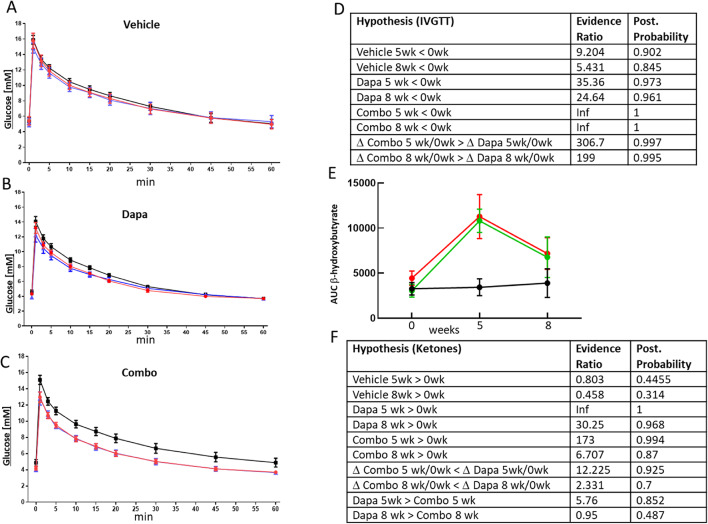
Fig. 3.
Glucose tolerance and ketone levels in NHP. Glucose concentrations during IVGTT in NHP for vehicle (A), dapagliflozin (B) and combo (C) treated animals. For each treatment group glucose concentrations at baseline (black) and after 5 (blue) and 8 weeks (red) treatment are depicted. AUC for the data shown in A–C were calculated (not shown) and analyzed using Bayesian statistics. Resulting evidence ratio and posterior probability Bayesian statistics for the indicated hypothesis are shown in (D). AUC’s for ketone levels obtained from same samples as used for A–C are shown in E in black for vehicle, green for Dapa and red for combo treatment. Results from Bayesian analysis with accompanying hypothesizes are summarized in (F)

