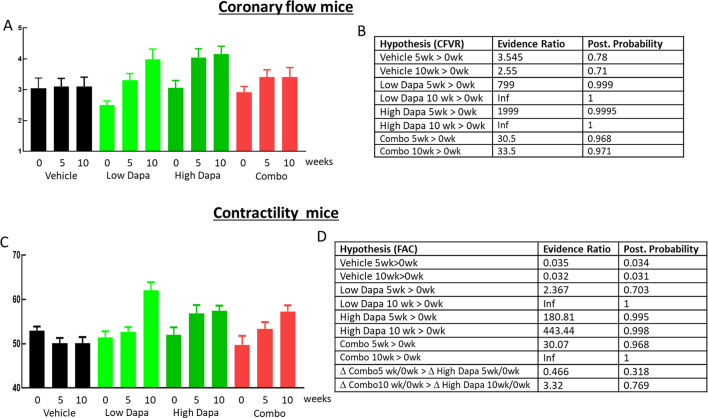
Fig. 4.
Cardiovascular function in ob/ob mice. Coronary flow velocities were measured as described under methods and coronary flow velocity reserves calculated by dividing stimulated with basal flow velocity. Flow reserves are shown (A) for baseline and after 5 and 10 weeks treatment as indicated. Data are color coded for the treatment groups vehicle (black), low dapagliflozin (light green), high dapagliflozin (dark green) and combo treatment (red). Data are shown as average +/- SEM. Contractility expressed as fractional area change (FAC) are shown in C for the same time points and color coding for treatment group as in (A). Evidence ratios and posterior probabilities based on Bayesian statistics for the indicated hypothesis are given in (B) for CFVR and in (D) for contractility

