Figure 3.
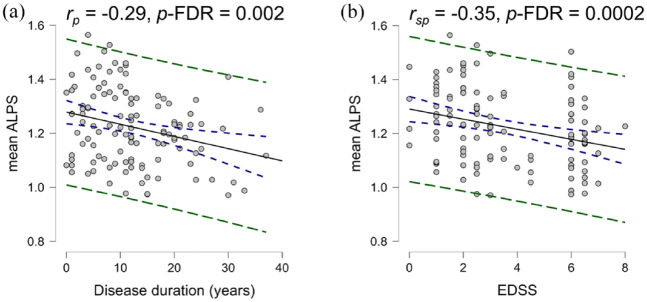
Correlations with disease duration and EDSS. (a) Pearson’s correlation calculated between mean DTI-ALPS index and disease duration adjusting for sex and (b) Spearman’s correlation calculated between DTI-ALPS index and EDSS adjusting for age and sex. Blue dashes represent the confidence interval, and green dashes represent the prediction intervals.

