Figure 1.
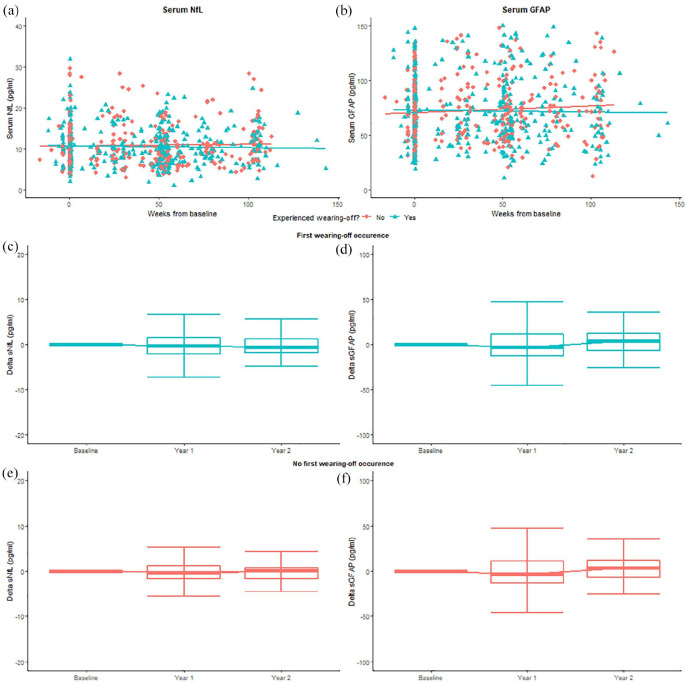
sNfL and sGFAP levels over time. (a) and (b) The x-axis displays continuous time points (weeks from baseline). The y-axis displays sNfL levels in pg/mL (a) and sGFAP levels in pg/mL (b). Baseline represents the start of extended interval dosing for each dose. Samples for the current study were retrieved at the start of the study, year 1 and last follow-up. The figures illustrate no significant difference in sNfL and sGFAP levels over time between participants with WoS and without WoS. (c)–(f) The x-axis displays timepoints (baseline, year 1 and year 2). The y-axis displays the absolute difference in sNfL ((c) and (e)) and sGFAP ((d) and (f)) levels compared to baseline. The figures illustrate no significant change in biomarker levels between participants with first-time WoS occurrence during follow-up and those without.
WoS: wearing-off symptom; sNfL: serum neurofilament light; sGFAP: serum glial fibrillary acidic protein.

