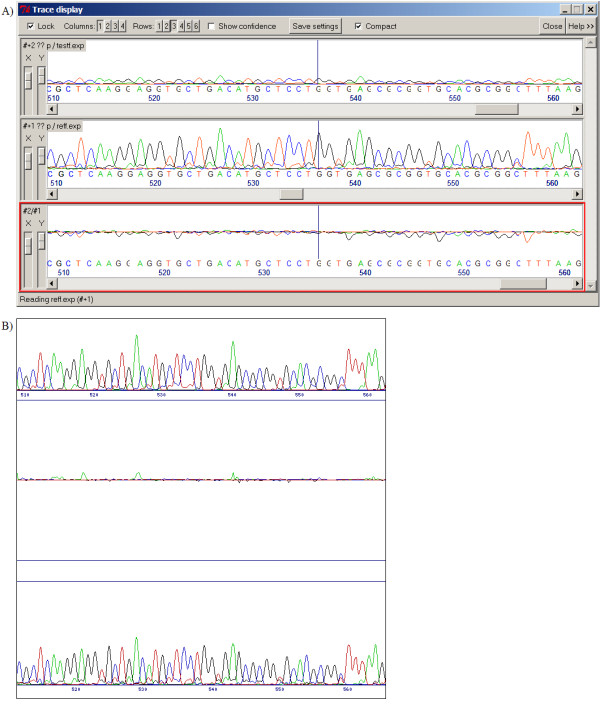
Figure 4.

Comparison of weak and strong sequence traces. Weak and strong sequence traces are successfully aligned by both Staden's Gap4 program (fig 4a) and SeqDoC (fig 4b). The local normalisation algorithms of SeqDoC mean that the two traces are displayed with comparable peak heights (weak trace at the top), and possibly results in a less noisy difference profile. Both figures show the same region of the same sequences.
