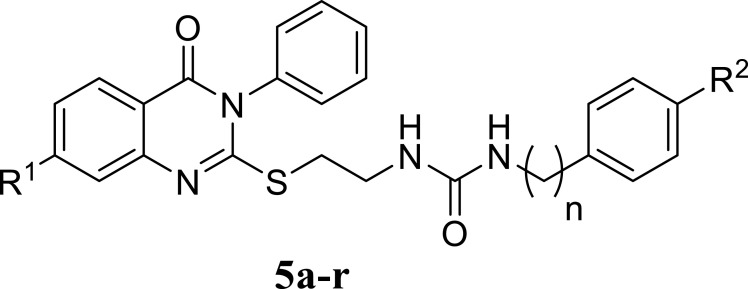
Table 1.
The Activities of the Novel Compounds 5a-r Over Normal Cells (WI-38) and 4 Cancer Cell Lines (Using SOR as a Reference) and the Values of Their IC50 (μM) are Provided
 | ||||||||
|---|---|---|---|---|---|---|---|---|
| Comp. no.* | R1 | R2 | n | IC50 (µM)** | ||||
| HCT-116 | HePG-2 | Hela | MCF-7 | WI-38 | ||||
| 5a | H | OCH3 | 0 | 62.70±3.6 | 81.29±4.3 | 83.41±4.4 | 79.47±3.9 | 29.42±2.1 |
| 5b | H | Cl | 0 | 77.26±4.2 | 88.46±4.8 | >100 | 92.19±4.7 | 64.31±3.7 |
| 5c | H | Br | 0 | 48.22±3.0 | 57.82±3.6 | 67.67±3.9 | 55.15±3.2 | >100 |
| 5d | H | CF3 | 0 | 6.09±2.2 | 2.39±0.1 | 8.94±0.7 | 4.81±0.2 | 36.29±2.4 |
| 5e | H | H | 1 | 54.91±3.3 | 65.68±3.8 | 75.34±4.2 | 72.77±3.6 | >100 |
| 5f | H | OCH3 | 1 | 14.78±1.3 | 34.24±2.4 | 31.51±2.3 | 18.66±1.5 | 91.40±5.1 |
| 5g | H | Cl | 1 | 35.29±2.6 | 47.19±3.1 | 53.68±3.1 | 39.58±2.6 | 85.98±4.8 |
| 5h | H | H | 2 | 5.89±0.3 | 6.74±0.5 | 11.61±0.9 | 13.88±1.1 | 41.06±2.6 |
| 5i | H | Cl | 2 | 39.06±2.7 | 49.83±3.2 | 58.33±3.3 | 43.15±2.8 | >100 |
| 5j | Cl | OCH3 | 0 | 9.51±0.9 | 12.34±1.0 | 19.10±1.4 | 16.01±1.3 | 38.52±2.5 |
| 5k | Cl | Cl | 0 | 23.43±2.1 | 40.85±2.6 | 38.02±2.5 | 32.91±2.3 | >100 |
| 5l | Cl | Br | 0 | 28.64±2.3 | 44.74±2.9 | 49.41±2.9 | 37.25±2.5 | >100 |
| 5m | Cl | CF3 | 0 | 18.14±1.5 | 30.68±2.2 | 27.88±2.1 | 21.45±1.8 | 76.27±4.3 |
| 5n | Cl | H | 1 | 44.21±2.8 | 52.39±3.4 | 61.48±3.7 | 48.68±3.0 | 73.64±3.9 |
| 5o | Cl | OCH3 | 1 | 69.30±3.9 | 84.33±4.6 | 90.23±4.8 | 86.52±4.2 | 35.87±2.3 |
| 5p | Cl | Cl | 1 | 8.32±0.7 | 9.72±0.7 | 14.27±1.2 | 7.99±0.5 | 56.87±3.3 |
| 5q | Cl | H | 2 | 32.53±2.5 | 41.58±2.8 | 45.22±2.7 | 24.58±2.0 | 53.01±3.1 |
| 5r | Cl | Cl | 2 | 13.20±1.1 | 17.67±1.4 | 22.36±1.7 | 10.74±0.9 | 74.17±4.1 |
| SOR*** | - | - | - | 5.47±0.3 | 9.18±0.6 | 7.26±0.3 | 4.17±0.2 | 10.65±0.8 |
Note: *Symbols represent synthesized compounds. **The IC50 value is the dose at which 50% of tumor cell growth is inhibited. The data is shown as the mean ± SD from the dose-response graphs in triplicate. IC50 (mg/mL): 1–10 (very strong), 11–20 (strong), 21–50 (moderate), 51–100 (weak), 100–200 (very weak), above 200 (non-cytotoxic). ***SOR represents Sorafenib.
