Figure 3.
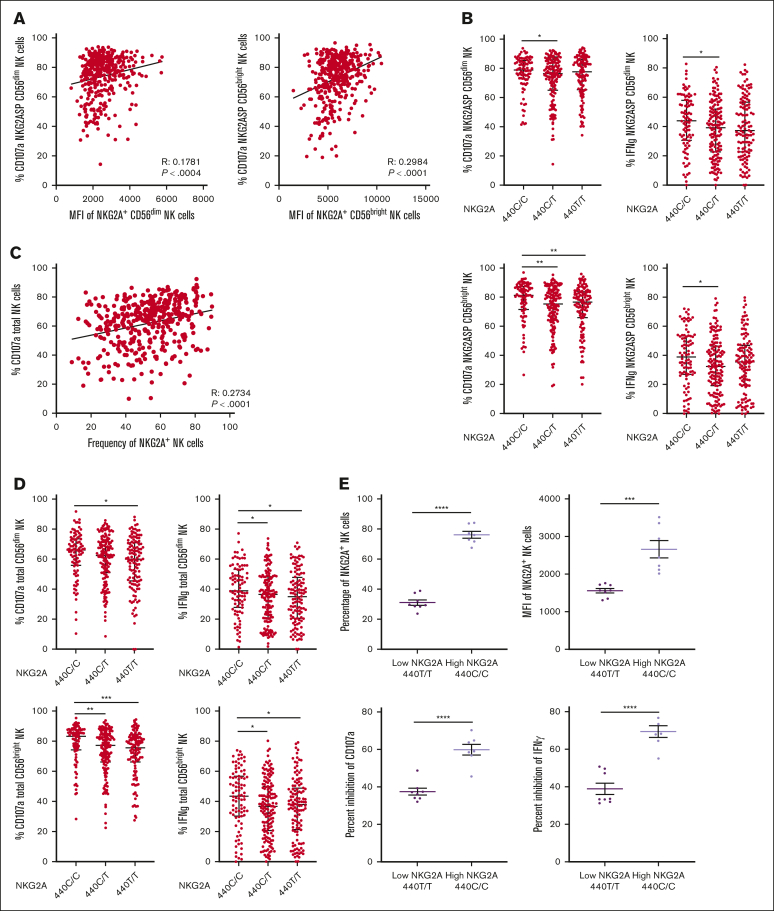
NKG2A surface density and frequency impact NK cell responsiveness. (A) Correlation between NKG2A MFI and degranulation of NKG2A+ CD56dim and CD56bright NK cells in a CD107a. (B) NKG2A-SP CD56dim or CD56bright NK cell degranulation and IFN-γ frequency stratified by SNP rs2734440 (440C represents rs2734440 T). (C) Correlation between NKG2A+ NK cell frequency and global NK cell degranulation. (D) Total NK cell degranulation and IFN-γ frequency in CD56dim or CD56bright NK cell stratified by SNP rs2734440. (E) Total NK cell inhibitability, measured by inhibition of CD107a and IFN-γ response in a killing assay against K562 HLA-E KO or K562 transduced with HLA-E in NKG2A high (440 C/C, n = 7) and low (440 T/T, n = 8) expression groups, as defined by the NKG2A genotype. Correlations were assessed using the Pearson correlation coefficient for panels A,C. Mann-Whitney tests were performed and median ± IQRs are presented in panels B,D. For panel E, t tests were performed, and mean ± SEM is presented. Symbols represent individual samples. ∗P < .05; ∗∗P < .01; ∗∗∗P < .001; ∗∗∗∗P < .0001.

