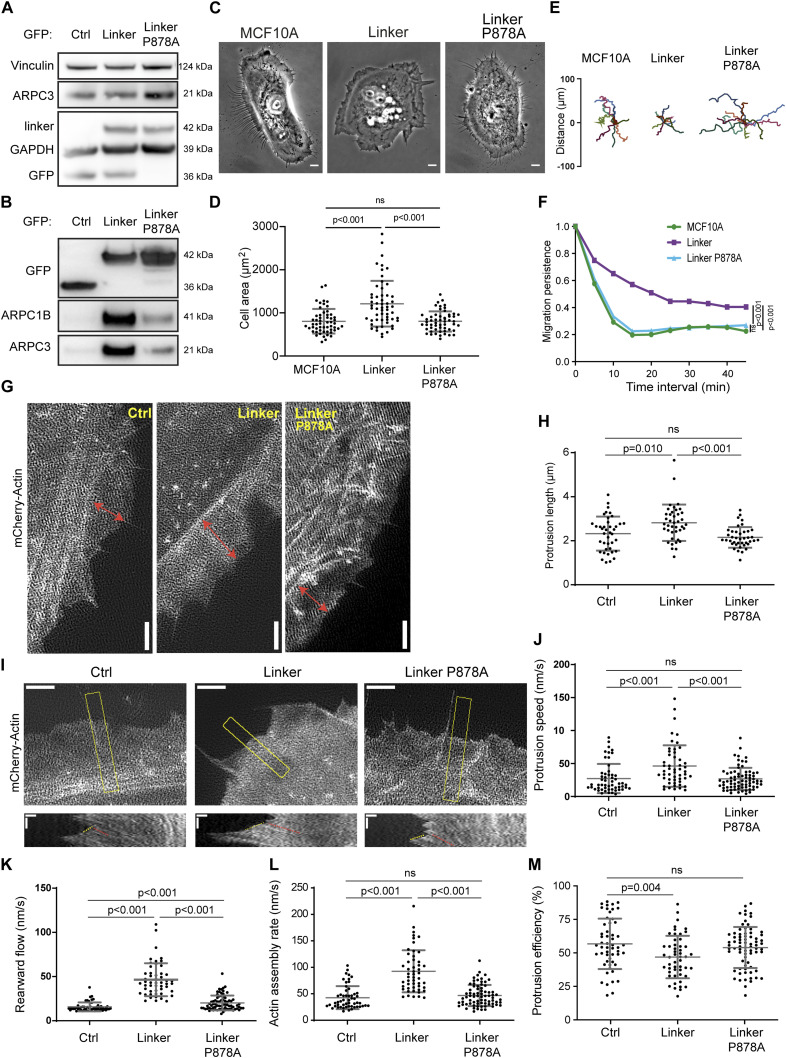
Figure 1. Expression of the vinculin linker that binds to the Arp2/3 complex increases actin polymerization and membrane protrusion.
(A, B) Arp2/3 complex co-immunoprecipitates with the vinculin linker (amino acids 811-881). (A, B) MCF10A cells stably expressing GFP, the GFP-tagged linker in a WT or P878A form, were lysed and subjected either to Western blot analysis (A), or to GFP immunoprecipitation and Western blot analysis (B). N = 3; 1 representative experiment shown. (C) Phase-contrast images of the same cell lines. Scale bar: 5 μm. (D) Cell area of the cell lines stained for actin. Mean ± SD, n = 56, t test. N = 3; pooled measurements from the three independent repeats are plotted. (E, F) Single-cell migration. (E, F) Cell trajectories (E) and migration persistence (F). Mean ± SD, n = 35, linear mixed-effect model. N = 3; pooled measurements from the three independent repeats are plotted. (G, H) Membrane protrusions of the stable MCF10A cell lines expressing the vinculin linker transiently transfected with mCherry–actin. (G, H) TIRF-SIM images of mCherry–actin (G) and quantification of protrusion length (H). Double-headed arrows in red indicate the length of lamellipodia. Scale bar: 2 μm. Mean ± SD, n = 40, t test. N = 3; pooled measurements from the three independent repeats are plotted. (I) Kymographs (bottom panels, scale bars: 0.4 μm horizontal, 40 s vertical) were generated along a line centered in the region boxed in yellow in the TIRF-SIM video (scale bar: 2 μm). (J, K) Dashed yellow and red lines indicate protrusion speed (J) and rearward flow (K), respectively. (L) Actin assembly rate (L) is the sum of protrusion speed and rearward flow. (M) Protrusion efficiency (M) is the ratio of protrusion speed to actin assembly rate. Mean ± SD, n = 40, t test. N = 3 with similar results; pooled measurements from the three independent repeats are plotted.

