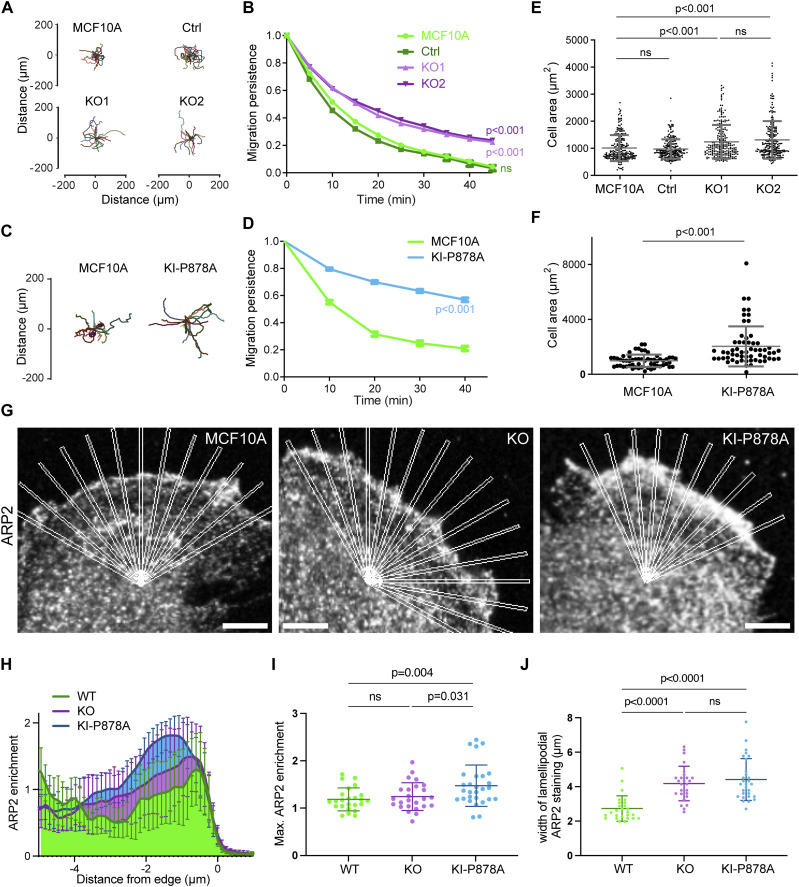
Figure 3. Vinculin decreases migration persistence and Arp2/3 recruitment in membrane protrusions through its interaction with the Arp2/3 complex.
(A, B, C, D) Single-cell migration of KO and KI-P878A cells. Cell trajectories (A, C) and migration persistence (B, D). (B, D) Mean ± SD, n = 75 in (B) and n = 35 in (D), linear mixed-effect model. N = 3; pooled measurements from the three independent repeats are plotted. (E, F) Cell area of KO and KI-P878A lines. (E, F) Mean ± SD, n = 228 in (E) and n = 59 in (F), t test. N = 3; pooled measurements from the three independent repeats are plotted. (G) Staining of ARP2 in the lamellipodium of parental, KO, and KI-P878A cells on single-plane confocal microscopy images. Scale bar: 5 μm. (H) Recruitment of ARP2 assessed by multiple radial line scans. Average profiles of ARP2 enrichment in the lamellipodium of parental, KO, and KI-P878A cells upon registering line scans to the cell edge. (I, J) Maximum intensity (I) and average width (J) of ARP2 staining at the edge of the lamellipodium. Mean ± SD, n = 29, t test. N = 3 with similar results; pooled measurements from the three independent repeats are plotted.

