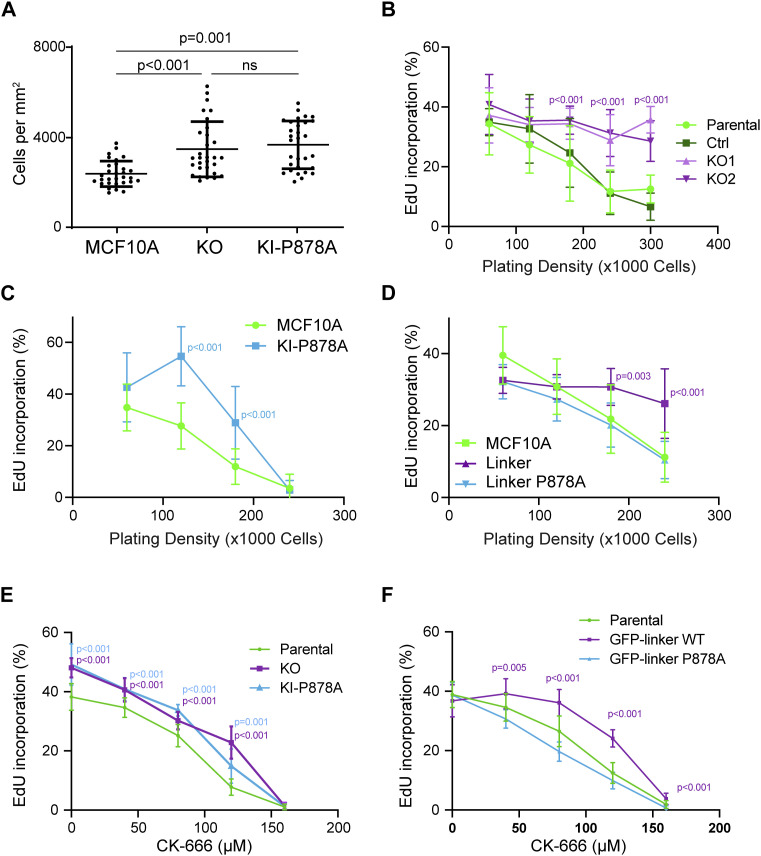
Figure 8. Vinculin controls cell cycle progression through its interaction with the Arp2/3 complex.
(A) Saturation density of KO and KI-P878A cells. Mean ± SD, n = 30, t test. N = 3 with similar results; pooled measurements from three independent repeats are plotted. (B, C, D) Cell cycle progression of KO- (B), KI-P878A– (C), and linker-expressing MCF10A cells (D). The percentage of cells incorporating EdU is represented as a function of cell density. N = 3 with similar results; pooled measurements from the three independent repeats are plotted. (E, F) Cell cycle progression of KO and KI-P878A cells (E), or linker-expressing MCF10A cells (F) plated at a density of 5 × 10⁴ cells and treated with increasing doses of the Arp2/3 inhibitory compound CK-666. Mean ± SD, n = 8 fields of views per repeat with more than 15,000 cells in total, t test. N = 3 with similar results; pooled measurements from the three independent repeats are plotted. (B, C, D, E, F) P-values are shown only when both KOs and KI-P878A cells are different from both controls (B, C, E) and when the linker is significantly different from parental MCF10A (D, F).

